Yesterday’s post focused on the UK. It showed that as COVID transitioned from the Delta dominant phase to an Omicron dominant phase, the infection rates of the vaccinated grew quickly relative to infection rates of the not-fully vaccinated.
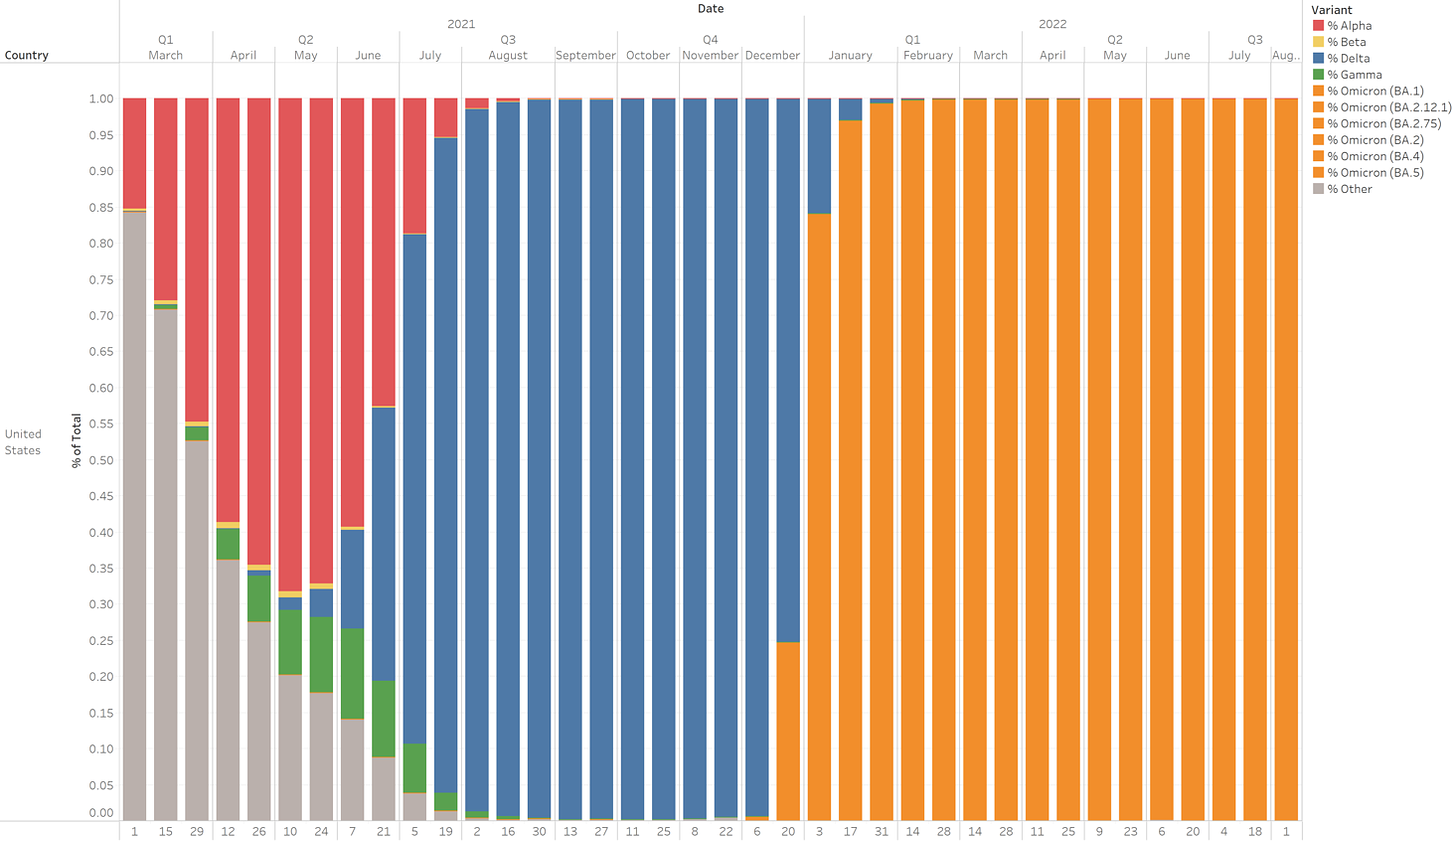
In order to investigate whether the US data supports this hypothesis, a slightly different approach is required. I am not aware of any set of data for the US that I trust providing infection (or hospitalization & death) rates by vaccination status. Whenever someone reports such figures in the US, they are so wildly different (and more favorable to vaccines) than other sources (UK, Israel, etc.), that I think they are worth less than zero. Instead, as in previous posts, I will examine the relationship between the % of population vaccinated within in a US County and the infection rates per 100K in that county. The new idea here is that I will split the data into different time periods based on the prevalent variant at a given time. Using the data from Our World in Data (raw data sourced from GISAID) that I introduced in yesterday’s post, here is the record of % of each variant present over the last 18 months or so:
The above chart shows Alpha in red, “Other” in grey, Delta in blue, and Omicron (including all sub-variants) in Orange. For purposes of analysis, I will divide the entire period into 3 sub-periods to study: Pre-Delta, Delta, and Omicron:
Note that I am not including the two-week periods where there is significant mix between two of the variants, those will simply be ignored in what follows. This leaves us with the following definitions:
Pre-Delta: A mix of Alpha and Other (original strain? I don’t know); March 1, 2021- May 24, 2021
Delta: Almost exclusively Delta; July 6, 2021-Dec 6, 2021
Omicron: Almost exclusively Omicron; Jan 4 2022- Aug 1 2022
With those definitions, we can now look at the US County level to see the relationship between vaccination rate (using the Median number during that period of time) and the infection rates per 100K population. I have filtered the data to include only counties with >10,000 people, counties who’s vaccination rate reporting was considered reasonably “complete” (there is a “completeness” field in the CDC data) and excluded some obviously flawed data points (individual counties, and the state of TX, whose reporting looked extremely wacky during Delta).
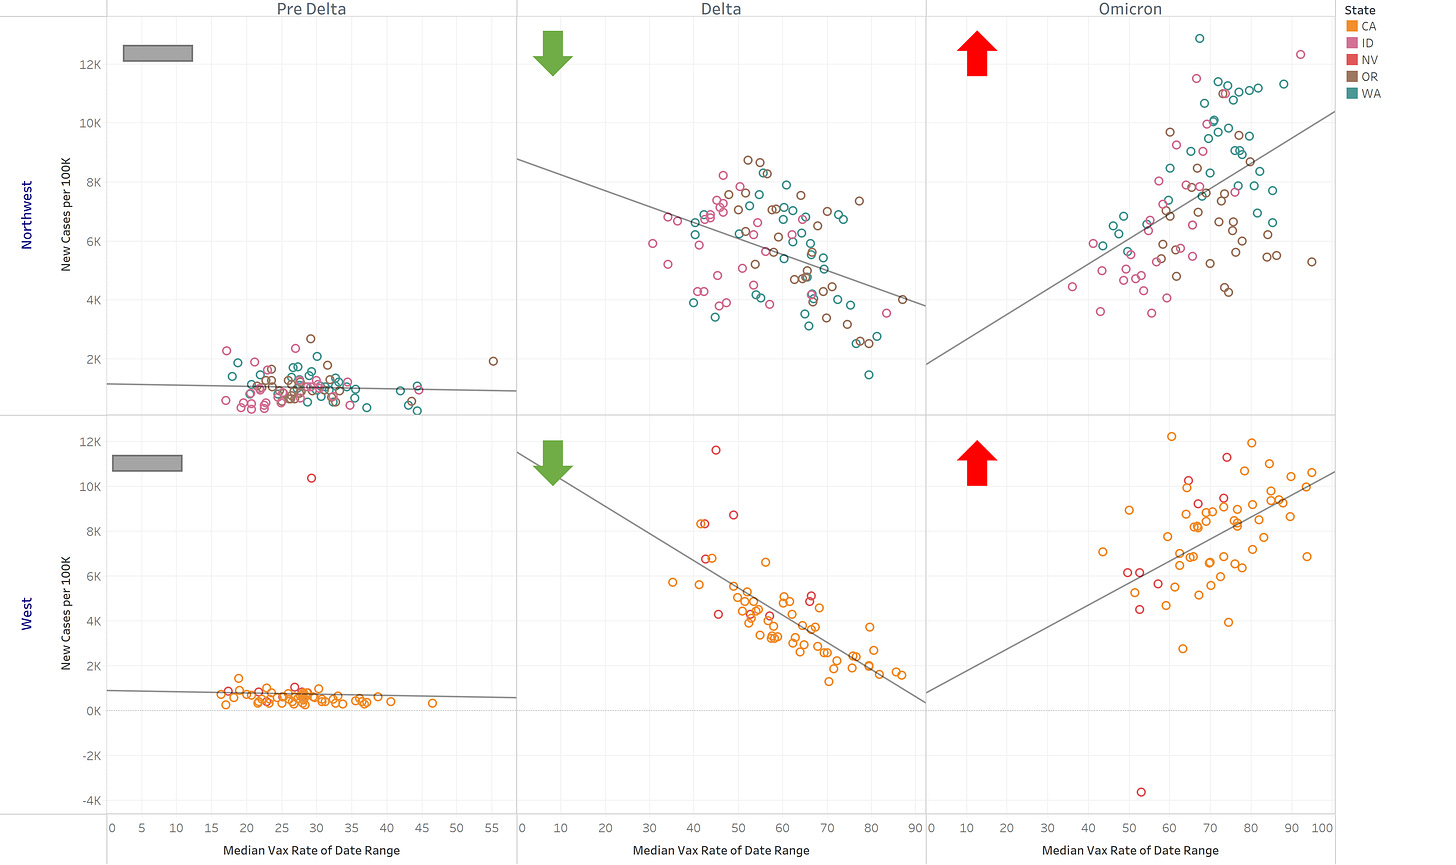
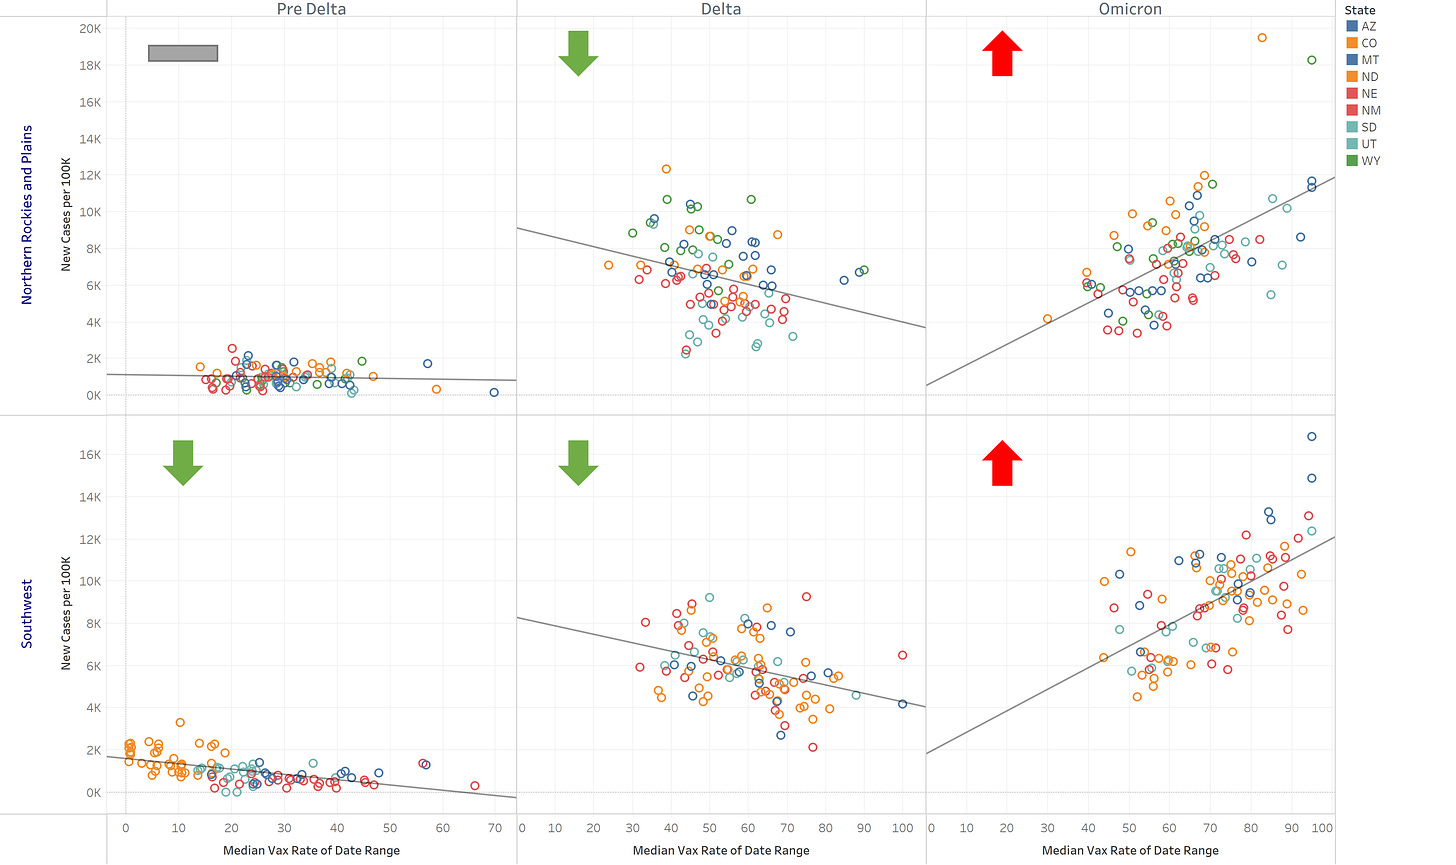
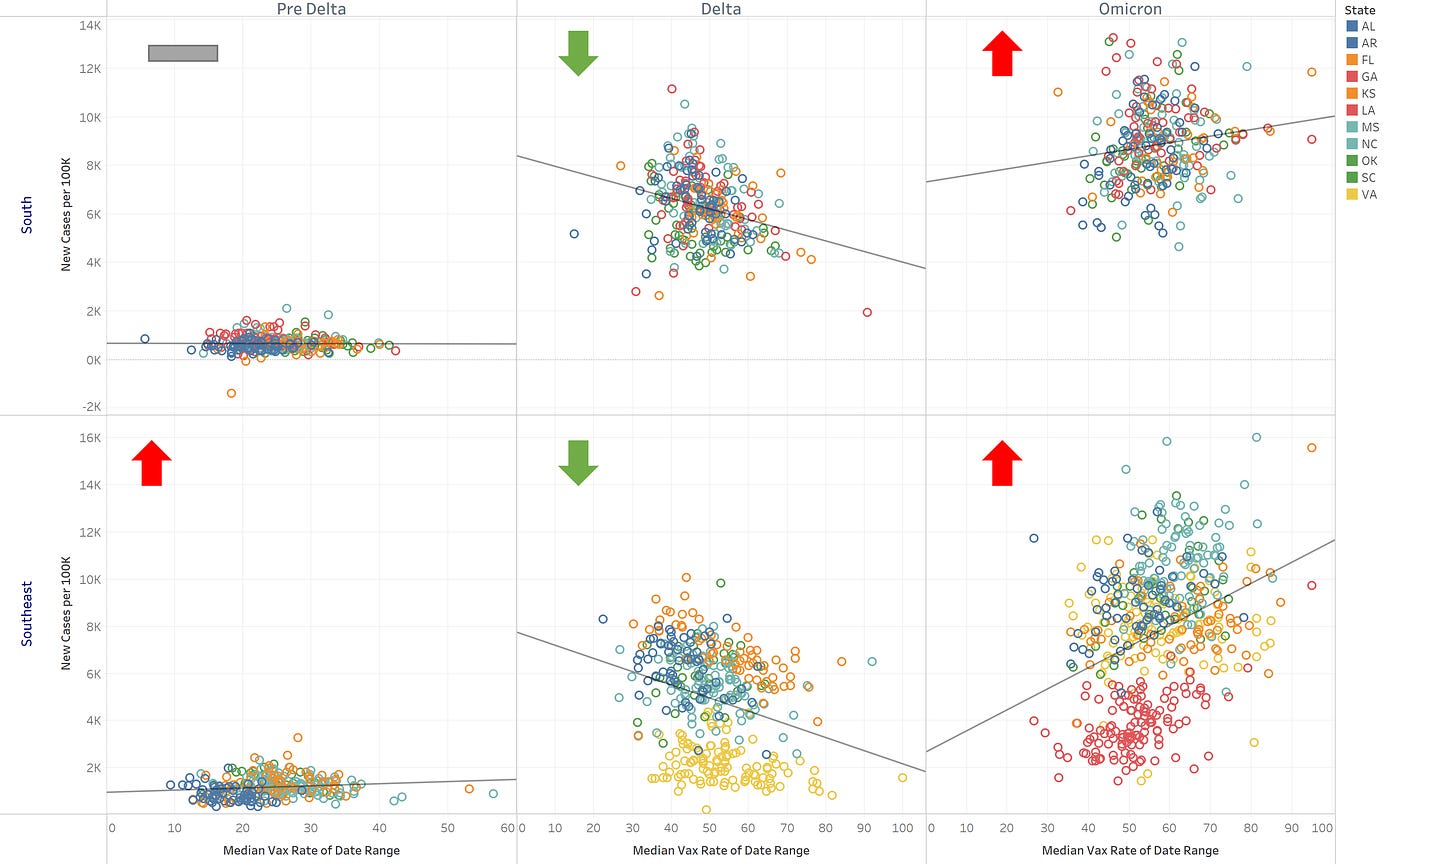
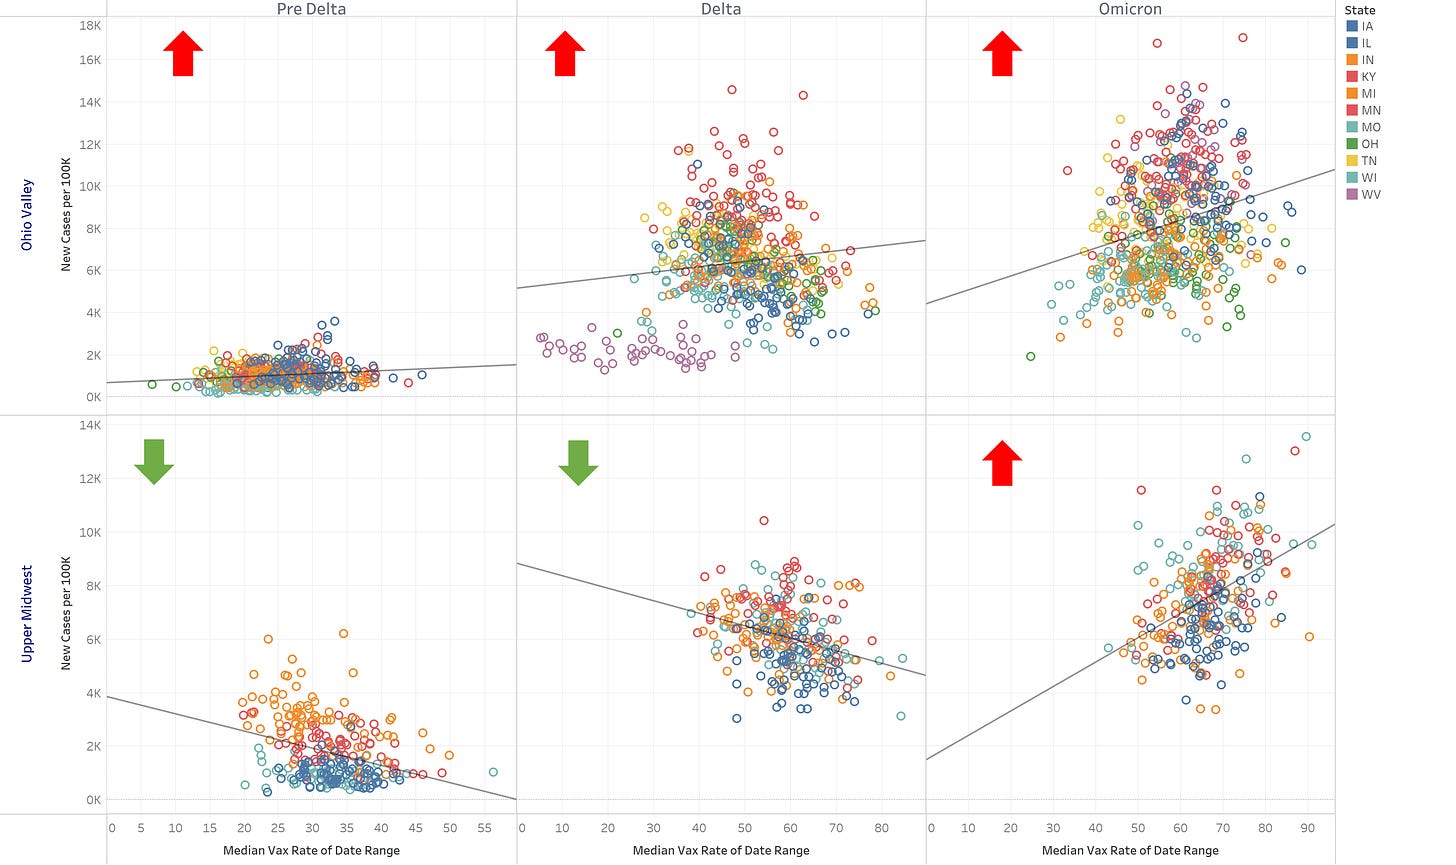
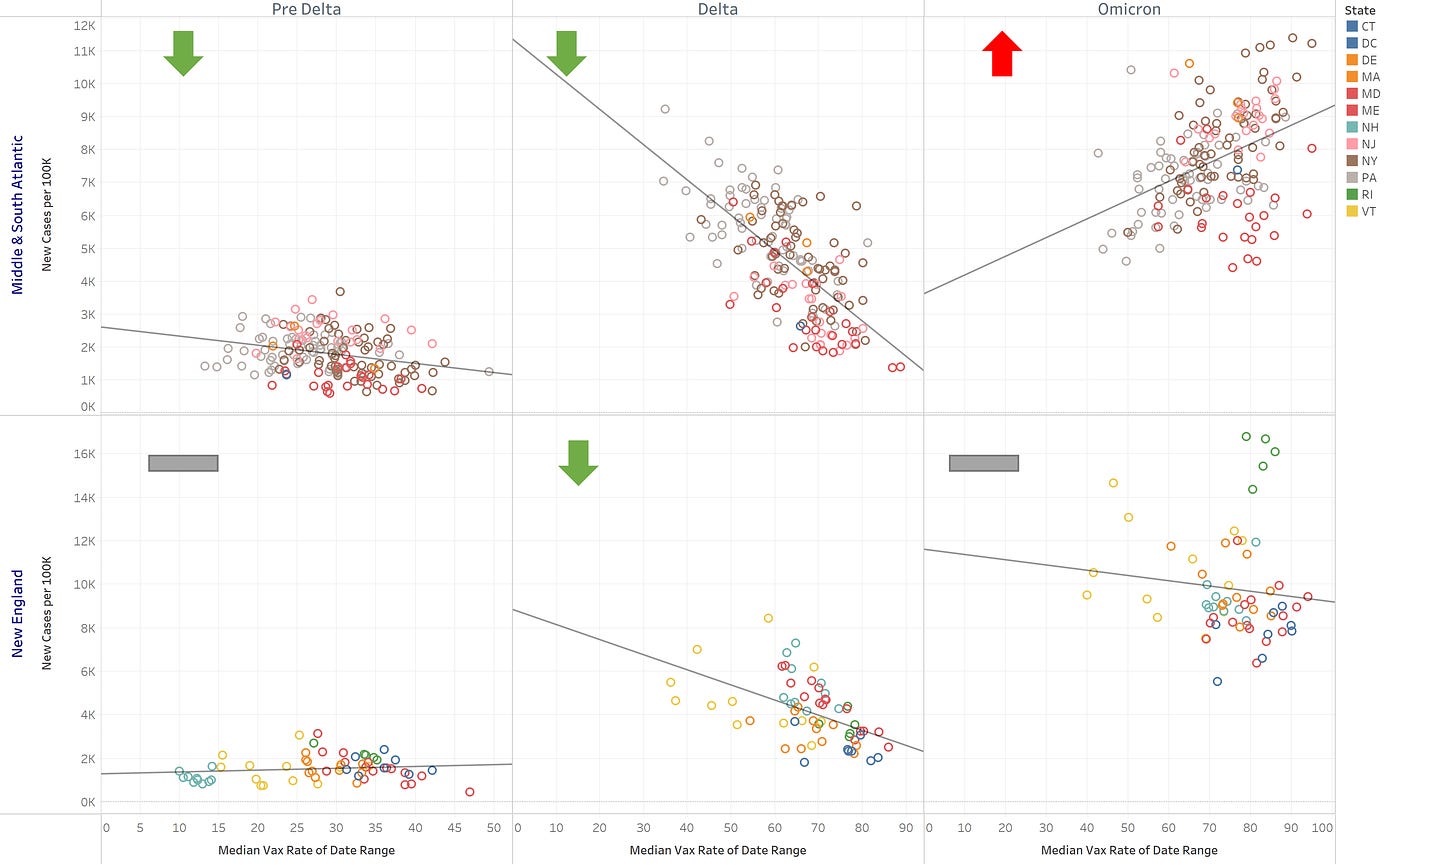
Here are those plots segmented by Geographic Region (each dot represents a county, color indicates state). I have placed a green downward arrow in plots where increased vaccination is correlated with fewer infections, a red upward arrow in plots where it increased vaccination was correlated with higher infection rates, and a grey horizontal box in places where no statistically significant relationship exists.
West and Northwest
Southwest and Northern Rockies and Plains
South and Southeast
Ohio Valley and Upper Midwest
Mid & South Atlantic and New England
Summary
From the above plots, a general theme is readily apparent.
Pre-Delta
No real conclusions about the effectiveness of the vaccines are possible. The vaccination rates were much lower, and the infection rates were much lower. Half the regions showed no statistically significant correlation, while 3 regions showed vaccination correlated with reduced infection, and 2 regions showed vaccination correlated with increased infection.
Delta
With the lone exception of the Ohio Valley region (and I suspect possible wacky data from West Virginia (purple circles) is the reason for this, we see statistically significant correlation between higher vaccination rates and lower infection rates.
Omicron
With the lone exception of the New England, where we found no statistically significant correlation, we see statistically significant correlation between higher vaccination rates and higher infection rates.
Conclusions
I see two primary hypotheses that are consistent with the above data:
Omicron infection enhancement hypothesis: The vaccine was effective in blocking transmission against Delta, resulting in higher vaccinated populations to have lower rates of infection. Subsequently, the Omicron variant more easily infects the vaccinated, thereby flipping the script completely (all of the Green Down arrows switching to Red Up arrows in the above plots).
VE fade & natural immunity hypothesis: This hypothesis would rely on 1) Vaccine’s efficacy against infection fading over time and 2) Natural immunity being stronger and more durable. In this case, many folks originally had protection through the vaccine, meanwhile a lot more of the unvaccinated got COVID. Therefore, going into Omicron season, the unvaccinated had a higher rate of natural immunity (which was durable & preventing re-infections), while the vaccinated protection had faded to essentially nothing.
I have many very bright readers. Which hypothesis seems more likely? Is there additional evidence to support either? Or do you have another hypothesis? I suppose it could also be 1+2.
Acknowledgement to GISAID
We gratefully acknowledge all data contributors, i.e., the Authors and their Originating laboratories responsible for obtaining the specimens, and their Submitting laboratories for generating the genetic sequence and metadata and sharing via the GISAID Initiative, on which this research is based.



The data on infection rates reflects positive PCR tests, which are generated by symptomatic disease as well as "close contact" testing. In the early Delta period, many of the vaccinated had either no or mild symptoms, and as such were less likely to test. Contact testing was also concentrated more on the unvaccinated, with vaccinated being considered so bulletproof that they were exempt from the testing requirements. I'm expressing this in general terms, of course, but it explains part of the negative correlation between Delta vaccination % and infection rate.
Wouldn’t looking at this by Covid labeled deaths (imprecise though this is it’s probably better than cases) be more instructive?
By this measure I’d expect high vax rates to be initially correlated with lower deaths simply because of the link between high vax acceptance rates and higher socioeconomic status and better preexisting health, major determinants of Covid death's.
Now, if that later reverses with boosters it tells an interesting story (of vax induced dysfunctional immune response).