In a recent post, the bad cat did a follow up on birth data in Sweden which shows a significantly lower number of births in 2022 vs. 2021. He instructs us to be cautious on drawing strong conclusions as the data available to us is not nearly enough to provide certainty of a fertility effect from the vaccination campaign.
It is beneficial, therefore, to look at as many data sets as possible to see if similar worrying signals are present elsewhere. In my last post relating to the data in the UKHSA reports, it looked as thought births were down in 2022 vs 2021 in the UK as well. The most recent report was published last week and contains this table:
So we have January- June data in 2021 & 2022. Plotting a comparison of each month by year, we see the following:
Yikes. Starting in January, we see each month is at minimum 6% lower in ‘22 than in ‘21 and is ~15% lower in June ‘22 vs. June ‘21. That seems almost too large to believe. So again (as in other cases I pointed out in previous posts), we are left to conclude that either a) there is an extremely worrying signal within the UK data, b) the UKHSA is incompetent and publishing erroneous data, or c) both. Note, I would like to compare this data to the years prior to 2021 to see if possibly 2021 was the anomaly, however to do so would require using ONS data which I have shown in a previous post significantly differs from the UKHSA data for 2021 🤦♂️
Another piece of data that might support the idea of the vaccines having an effect on fertility is the data on the composition of women giving birth. In particular, the reports contain information like the following:
This shows the socio-economic status (deprivation level) of women giving birth and their vaccination status. Since the beginning of 2022, this data has been updated in 7 reports (Week 4, 8, 12, 19, 24, 35, 40). Below I chart the proportion of women giving birth by deprivation level in each successive report:
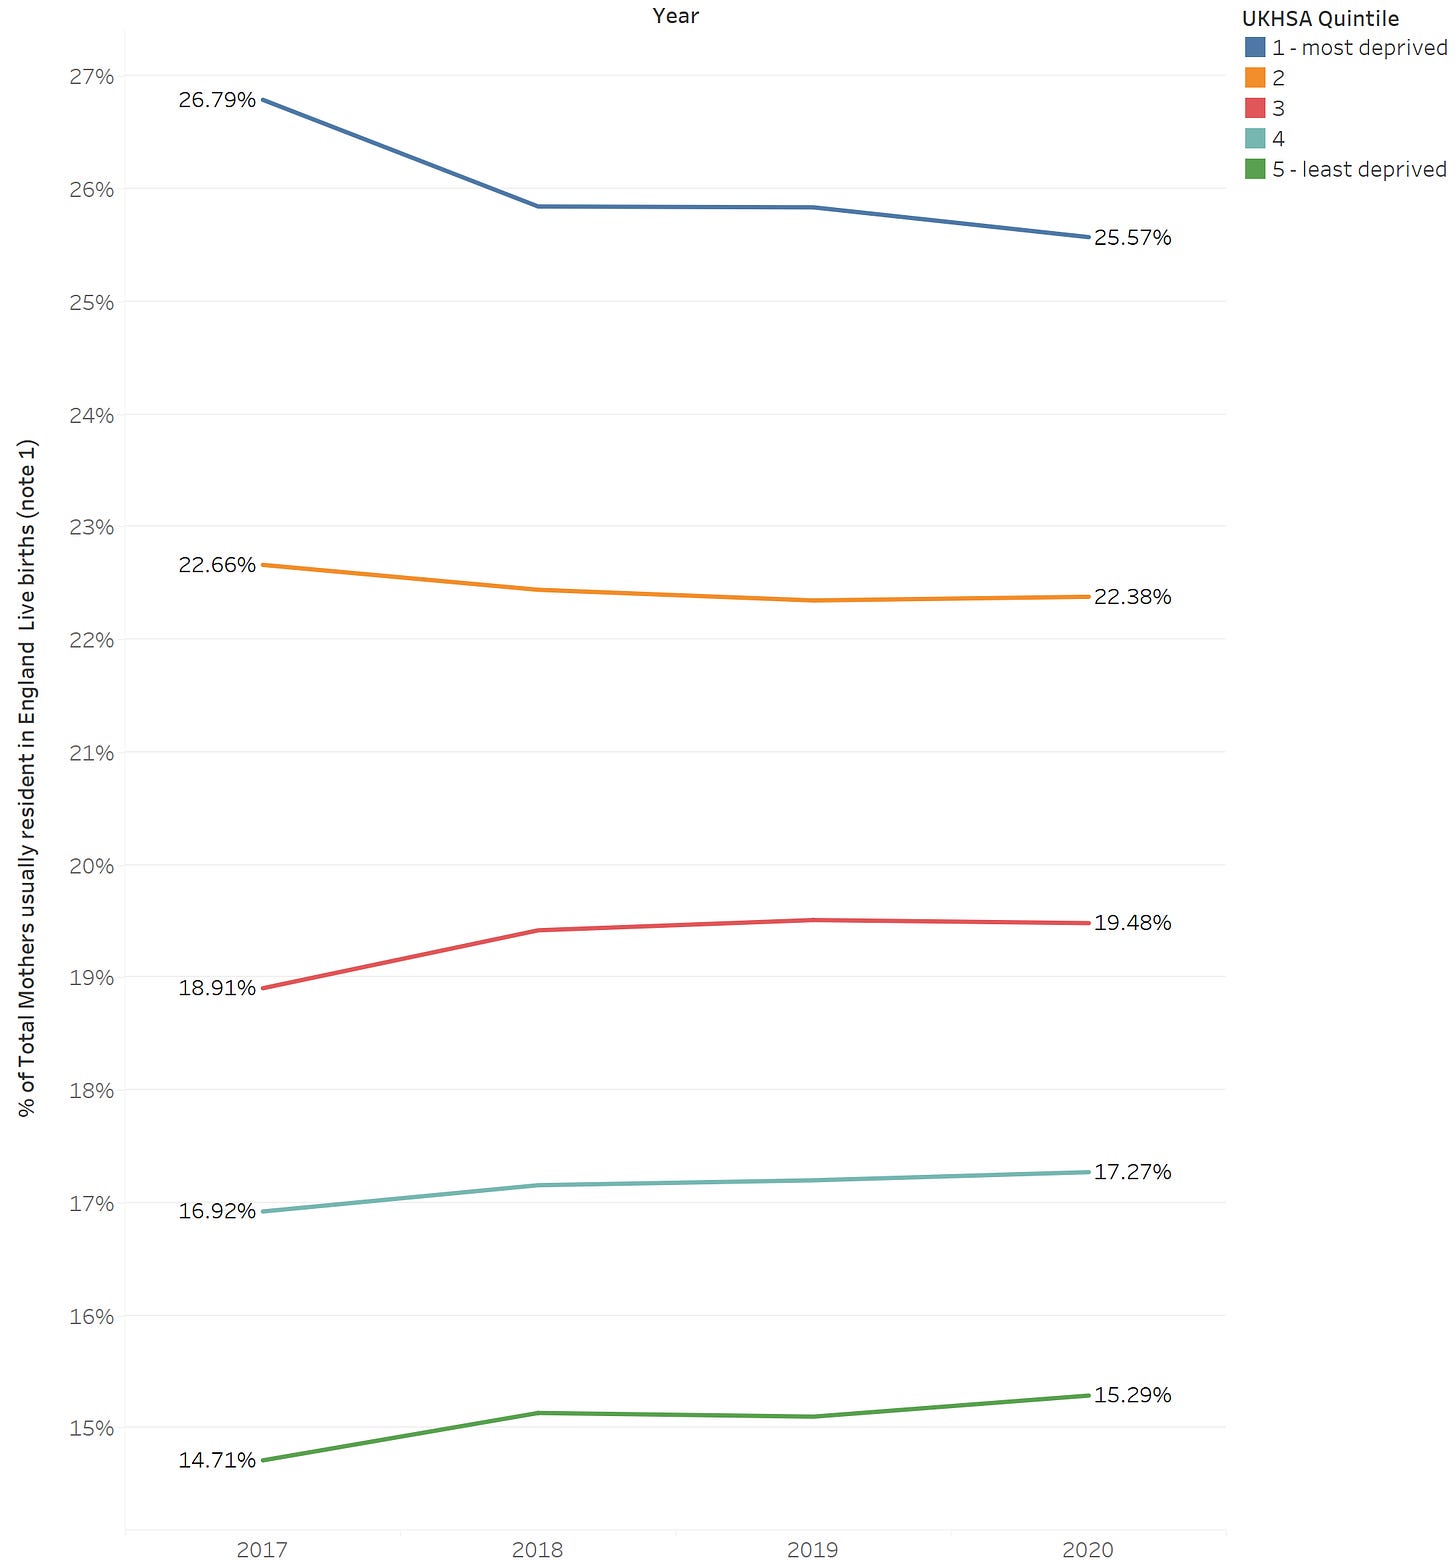
Why might this give us a clue? Well, we can see over time that the proportion of births to the most deprived 2 groups has risen, while the proportion of births to the 2 least deprived groups has fallen. When we look at data from the ONS in previous years (again ONS data and UKHSA data do not always agree, so we should use caution), we see the opposite trend in previous years:
So, per the ONS, from 2017 through 2020 the proportion of mothers who were least deprived was increasing, and the most deprived was decreasing. The trend is going the opposite way in 2022 from what we can see in the UKHSA data. This, coupled with the fact that the most deprived women are least likely to be vaccinated and least deprived women are most likely to be vaccinated provides another possible signal that should be explored. Again, we should be cautious to draw any conclusions, but I have no confidence that our public health agencies are asking these questions and doing this analysis.


Every piece of actual data seems to be against them, therefore they're frantically trying to bury all the data. Even so, we have awesome people like you who are willing to dig it out! Well done!!!
Every where I look, when it comes to Covid, "more analysis is needed". Which is sorta what you want our public health institutions to do.
I've never seen the wholesale level of reputation destruction as our PH infrastructure in the past 3 years.