I recently heard Dr. Pierre Kory on a podcast discuss the increase in deaths among relatively young people (35-44) based on data in life insurance reporting. He has a substack post on the same topic…
The numbers quoted seemed almost too big to believe, so I wanted to dive into the data myself. I don’t have access to the life insurance companies’ data, so my analysis will be based on data from the CDC. Two data sets are used:
From CDC Wonder , a query was performed to obtain the yearly all cause deaths by state & age group for years 2018-2022 (some 2023 data is available but likely unreliable & not a full year in any case).
From CDC Provisional COVID-19 Deaths by Sex and Age we can then obtain how many of those deaths by state and age group were labeled as COVID deaths in 2020-22.
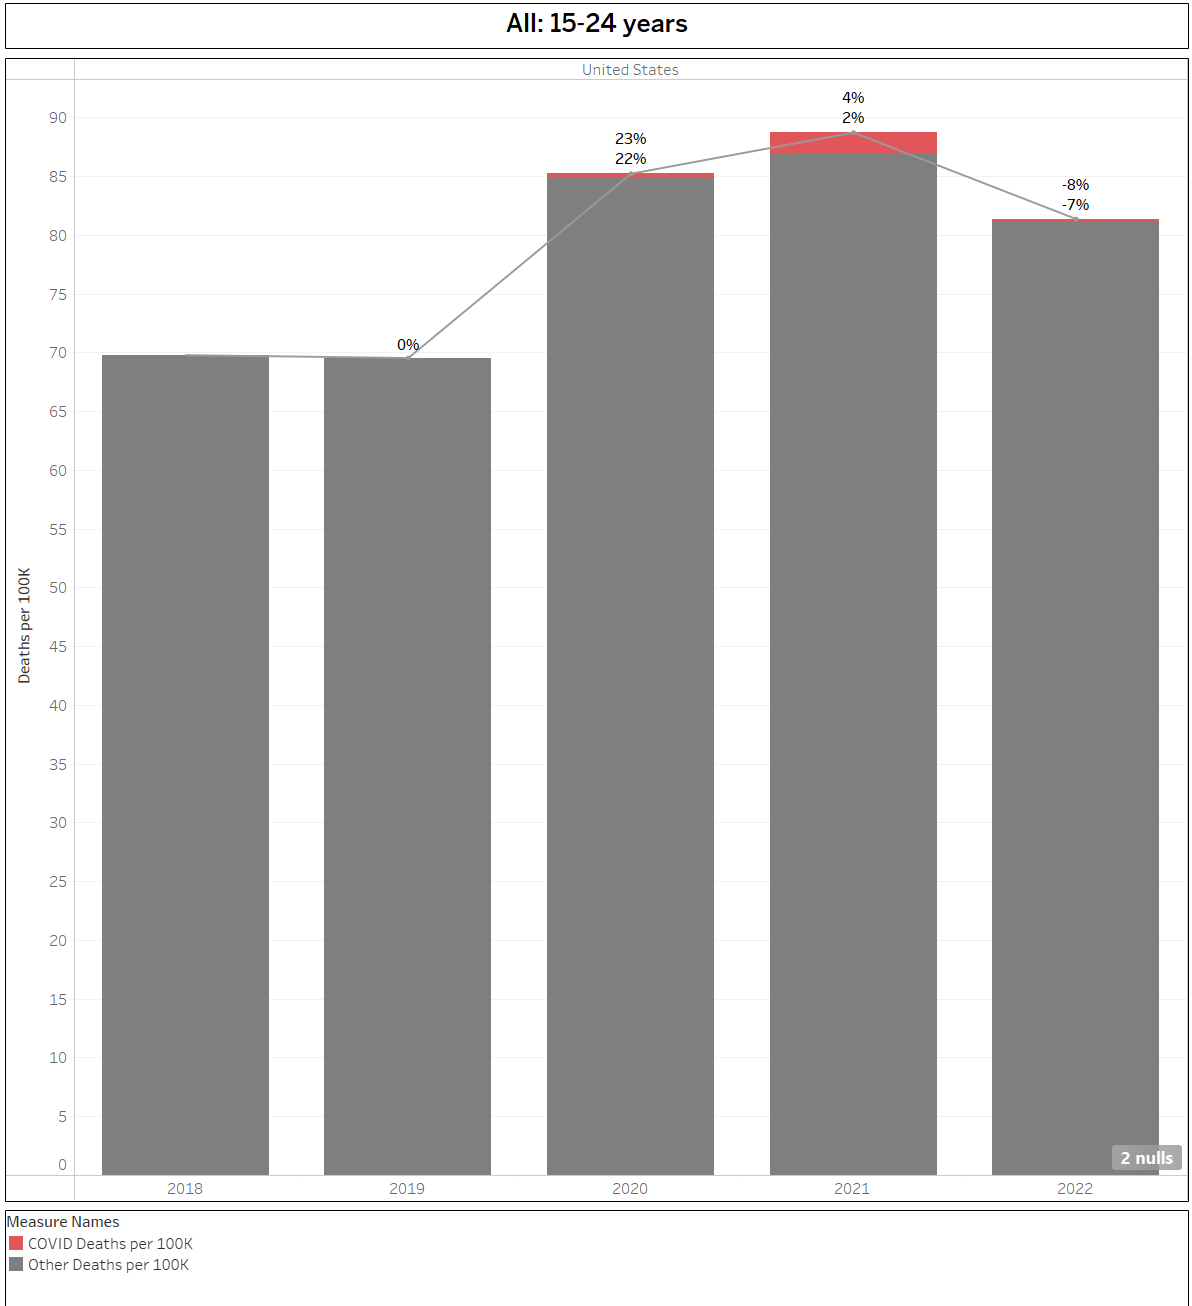
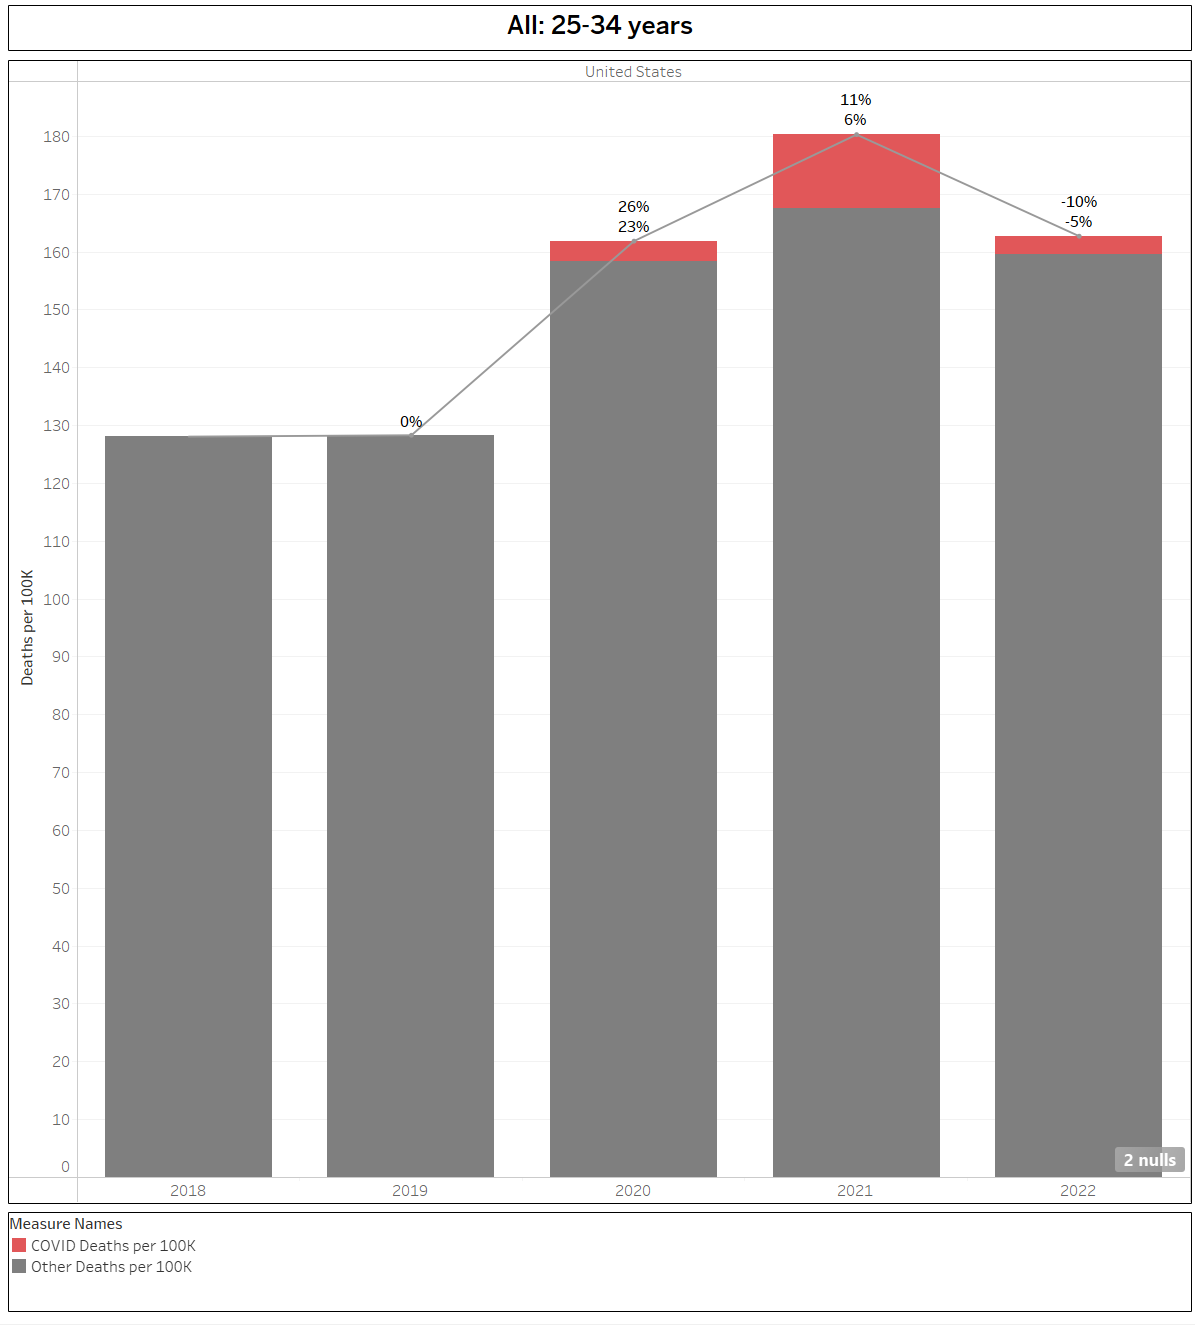
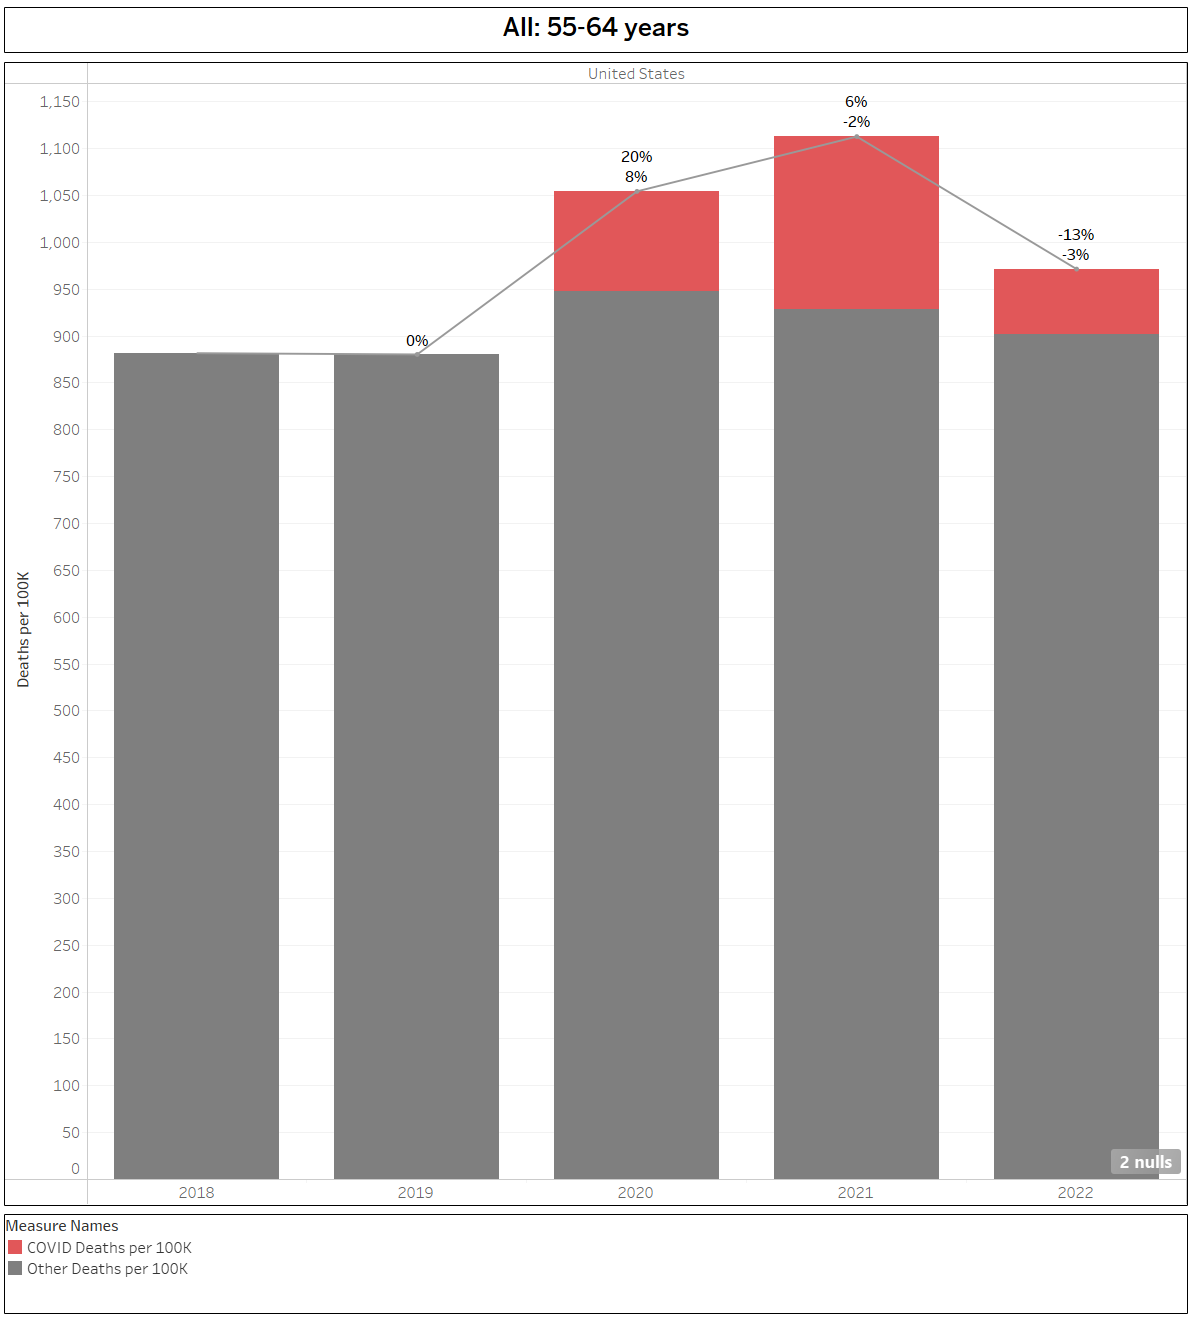
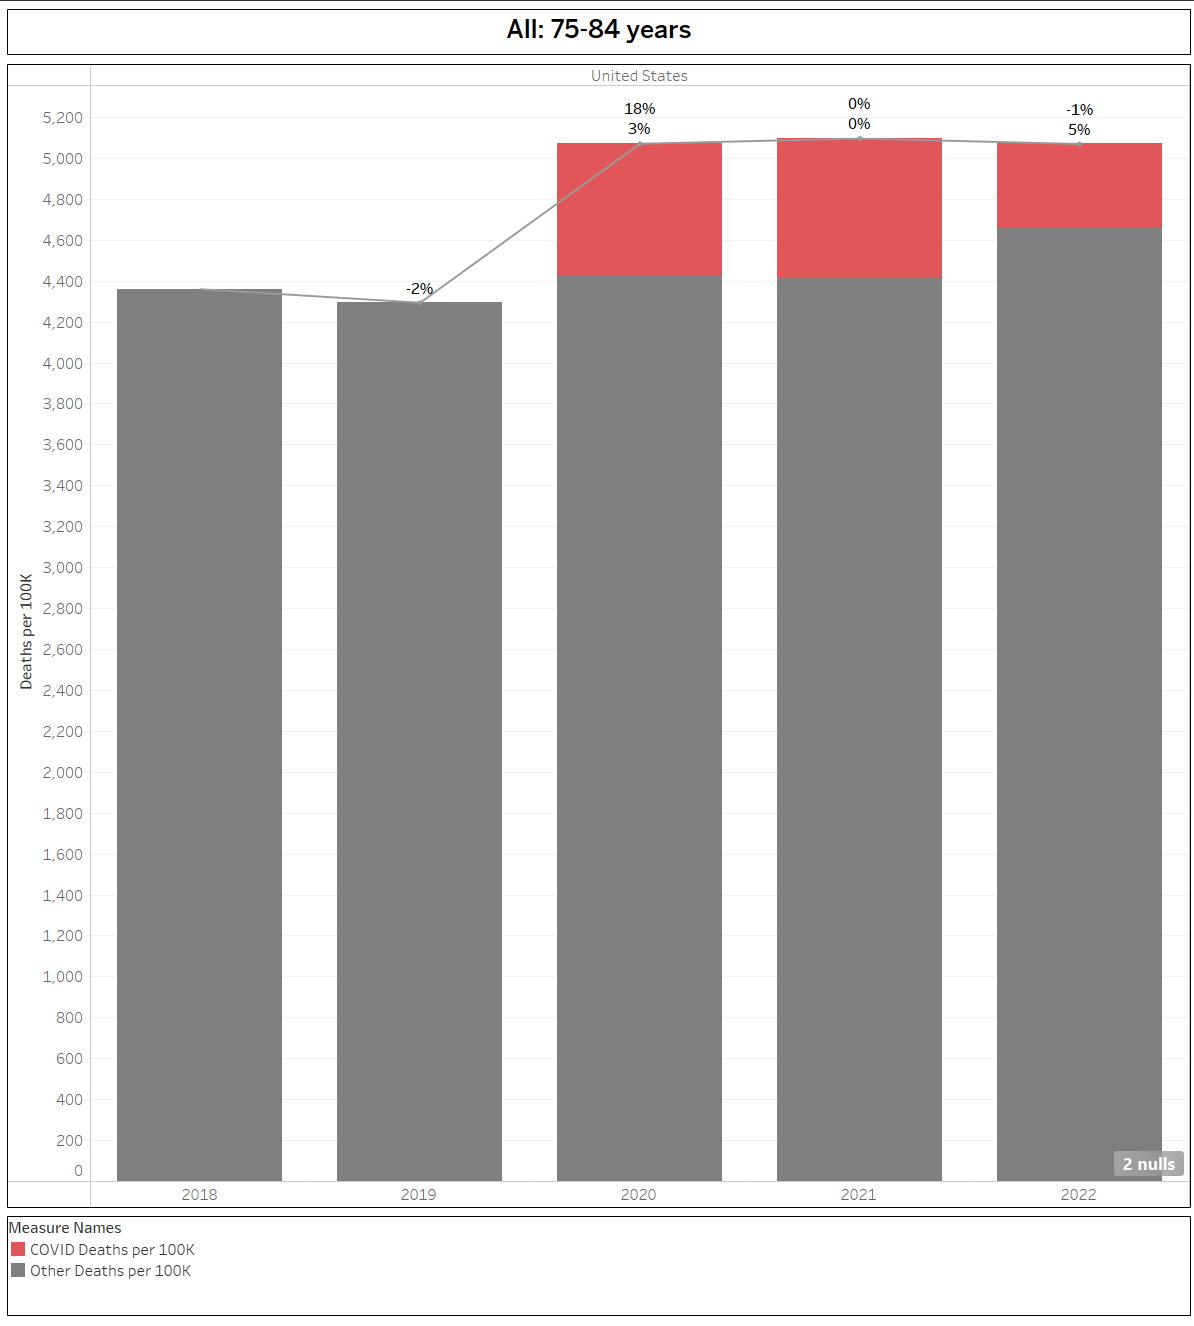
Using these two pieces of data, we can look at how total deaths changed year over year from 2018-2022 and in the 2020-22 period, how many of those deaths were labeled as COVID. Looking at the US as whole by age group, what we see is pretty alarming. In the charts below, I show by 10 year age groups, the non-COVID deaths in Grey bars & the COVID labeled deaths in Red on top. In 2019, you will see the change in Deaths per 100K population from 2018→2019. In 2020 & beyond, the top number represents the change in Total Deaths from previous year, while the 2nd number is the change in Non-COVID deaths.
15-24 year old summary
2018 →2019: Flat
2019→2020: Total deaths increase 23%, only a tiny portion is labeled COVID
2020→2021: Additional 4% increase in total deaths, of which half is labeled due to COVID
2021→2022: Total deaths decrease by 8%, COVID deaths almost non-existent. Numbers are still well above the 2018-19 base case.
25-34 year old summary
2018 →2019: Flat
2019→2020: Total deaths increase 26%, a mild portion is labeled COVID
2020→2021: Additional 11% increase in total deaths, of which almost half is labeled due to COVID
2021→2022: Total deaths decrease by 10%, reduction in COVID deaths are a large portion. Numbers are still well above the 2018-19 base case.
35-44 year old summary
2018 →2019: Increase of 3%
2019→2020: Total deaths increase 27%, approximately 1/4 is labeled COVID
2020→2021: Additional 14% increase in total deaths, more than half is labeled due to COVID
2021→2022: Total deaths decrease by 11%, reduction in COVID deaths are vast majority. Numbers are still well above the 2018-19 base case.
45-54 year old summary
2018 →2019: Decreased by 1%
2019→2020: Total deaths increase 23%, roughly half is labeled COVID
2020→2021: Additional 10% increase in total deaths, all due to COVID labeled deaths (Non-Covid deaths actually decrease 1%)
2021→2022: Total deaths decrease by 15%, reduction in COVID deaths are a majority. Numbers are still well above the 2018-19 base case.
55-64 year old summary
2018 →2019: Flat
2019→2020: Total deaths increase 20%, 60% is labeled COVID
2020→2021: Additional 6% increase in total deaths, all due to COVID labeled deaths (Non-Covid deaths actually decrease 2%)
2021→2022: Total deaths decrease by 13%, reduction in COVID deaths are a majority. Numbers are still well above the 2018-19 base case.
65-74 year old summary
2018 →2019: Decreased by 1%
2019→2020: Total deaths increase 20%, 75% is labeled COVID
2020→2021: Additional 2% increase in total deaths, all due to COVID labeled deaths (Non-Covid deaths actually decrease 2%)
2021→2022: Total deaths decrease by 8%, reduction in COVID deaths represent entire delta. Numbers are still well above the 2018-19 base case.
65-74 year old summary
2018 →2019: Decreased by 2%
2019→2020: Total deaths increase 18%, >80% is labeled COVID
2020→2021: Flat in both total deaths and COVID deaths
2021→2022: Total deaths decrease by 1%, all due to COVID deaths as Other Deaths increased by 5%. Numbers are still well above the 2018-19 base case.
Overall Summary
Very large increases in all-cause mortality started in all groups in 2020.
Paradoxically, while COVID obviously hit older groups the worst in 2020, younger groups actually had larger increases in all-cause mortality (WTF?)
All groups showed increased total deaths from 2019→2020 and 2020→2021 (except 75-84 yr olds, who were flat) and decreases in total deaths 2021→2022
Despite reductions in 2021→2022, all groups 2022 death rates remained well above 2018-19 levels. The increase from 2018-19 → 2022 was worst for 25-34 & 35-44 year old groups (again WTF?)
Primary questions coming out of this…. 1) Why did death rates soar in 2020 for all ages, even where COVID was not a major cause of death? 2) Why haven’t (at least as of end of 2022) death rates returned to their pre-COVID level? 3) Why aren’t any major news/health organizations asking these questions?
Explore the data yourself
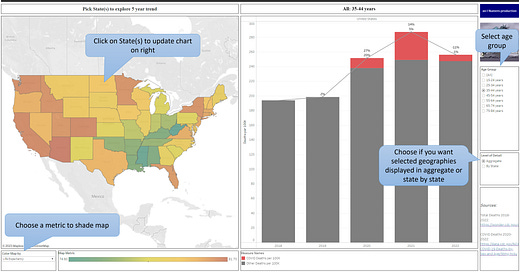
Click on the picture below to go to a dashboard I created to allow you to examine this data by state(s) & age group. I have put in navigation tips in pic below. Dashboard best viewed on larger screen in full screen mode.







The scary thing is that the situation doesn't seem to be improving. Remember how people use to joke it was VAIDS?
Curious if the younger age group issue still shows up so prominently if it was presented as excess mortality with a 5 year baseline?