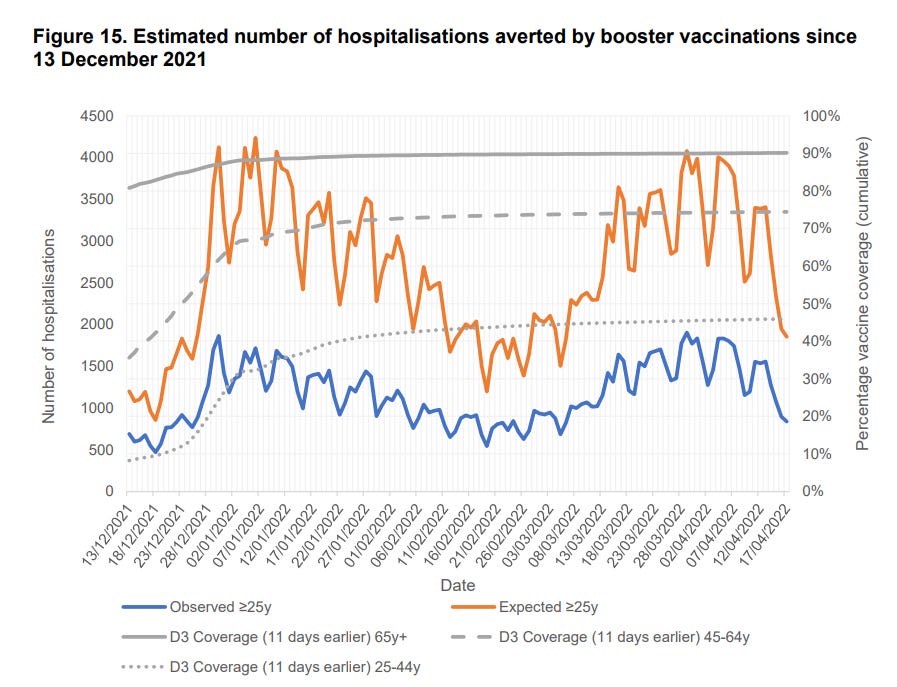
The UKHSA has released their week 19 COVID report . Since they have stopped reporting on actual cases, hospitalizations, and deaths by vaccination status, I just skimmed through other sections of the report that I may not have paid close attention to previously. In the very last section, they explain how they believe booster shots are responsible for avoiding many COVID related hospitalizations in the last 6 months. They conclude with a graph showing hospital admissions since Dec 13 2021 , as well as an estimate of what hospital admissions may have been without the booster shots. Here is the chart:
Per usual in this report, it’s not readily apparent what the source data for the blue line (actual hospital admissions) is, nor how exactly they calculated the orange line (expected hospital admissions without booster shots). So, I went on a little bit of detective work to see if I could recreate the analysis.
First, I found hospital admissions here: https://coronavirus.data.gov.uk/details/healthcare
Downloaded that data & plotted the same time period:
Is this the same data as in the UKHSA report? It does not appear so. If you notice, as best I can, the hospital admissions peak at ~2,000 in their chart, while the data I found peaks at close to 2,700. However, I hope I can convince you that we can use my data source for analysis. In particular, although the level (how high it goes) is different between the two charts, the shape (pattern of ups and downs) is pretty consistent. With some crude skills, I have overlaid my chart on top of theirs. Thin, darker blue mostly follows the thicker, brighter blue:
The UKHSA report says this is data for people >25, so perhaps the difference is that the data source I am using is capturing the <25 as well.
Ok, now I am left with trying to figure out how they plotted the orange line (projected hospitalizations without any booster shots). Although they provide some information and a link to still further information on how they are calculating Vaccine Efficiency against hospitalizations, I do not believe they provide enough data to be able to recreate any complex calculations to generate the orange line. Further, it’s not clear at all to me that anything complex is going on from the blue line to the orange line. To my eye, it looks roughly like the orange line is 2x the height of the blue line. Let’s try that and see how it works out. This would be my chart with this assumption:
Again, the levels are different, but how does the shape compare to the UKHSA chart? Let’s overlay mine on theirs:
Thin orange & blue lines are mine, thick lines are the UKHSA’s. Hot Damn, that looks pretty good!
Ok, now that we’ve established that I can approximate the hospital patterns they observed, and approximate their estimate on hypothetical hospitalizations in a world without boosters, let’s zoom out and look at hospitalizations over time in the UK, in addition to this period from mid December 2021 to mid April 2022:
Whoa. So, after extrapolating from their chart to the complete data set, it seems that the UKHSA is claiming is that, if not for the booster shots, the amount of hospitalizations in the UK in Q1 2022 would have been the highest of the entire pandemic! The previous high was in January 2021, when vaccines were just being rolled out and essentially no one had been given 2 doses. The implication, it would seem, is that a two dose regime of the vaccines is expected to have zero impact on hospitalizations. That’s an interesting admission to say the least.


Well, that's the implicit message in pushing boosters to begin with, so here Israel is one ahead of the UK since it went "4 style" with Omicron. But there's been no demonstrating of waning of severe efficacy, except perhaps against Omicron in which case there's no demonstration of a recapitulation of severe efficacy except via selection bias and maybe a temporary prevention of infection.
So the claim is built into the assumption used to make the claim. It's already visible that the Omicron peaks were ~1/2 the heigh of the Alpha peak. So if you are the UKHSA and you assume "thing" = 2x of 1/2... you get 1. Doesn't make the assumption accurate.
Oops! Down the memory hole with this!