Current conventional wisdom is that the vaccines don’t necessarily prevent infection all that well (or at the very least, that protection fades over time), but provide great protection against severe disease and death if infected. If this is the case, the effect of vaccines should be most readily apparent in the Case Fatality Rates, i.e. the ration of deaths to cases. For example, if the CFR was 1% and the vaccines are 90% effective against death, then a fully vaccinated population should have their CFR reduced to 0.1%. Therefore, looking at the CFR across counties with different vaccination rates might be instructive to analyzing the effectiveness of the vaccine.
This will be a bit of a Dragnet post ;-)
The data to analyze this is originally sourced from the CDC. Cases & deaths are obtained via USA Facts and vaccination rates directly from CDC. CFR is calculated simply by dividing the deaths by the cases. Note that this ignores the lag in cases→deaths, however in looking at a month’s of data, hopefully this does not alter the picture much.
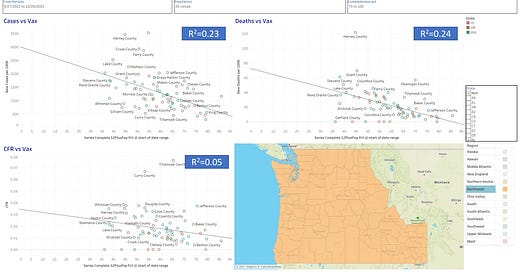
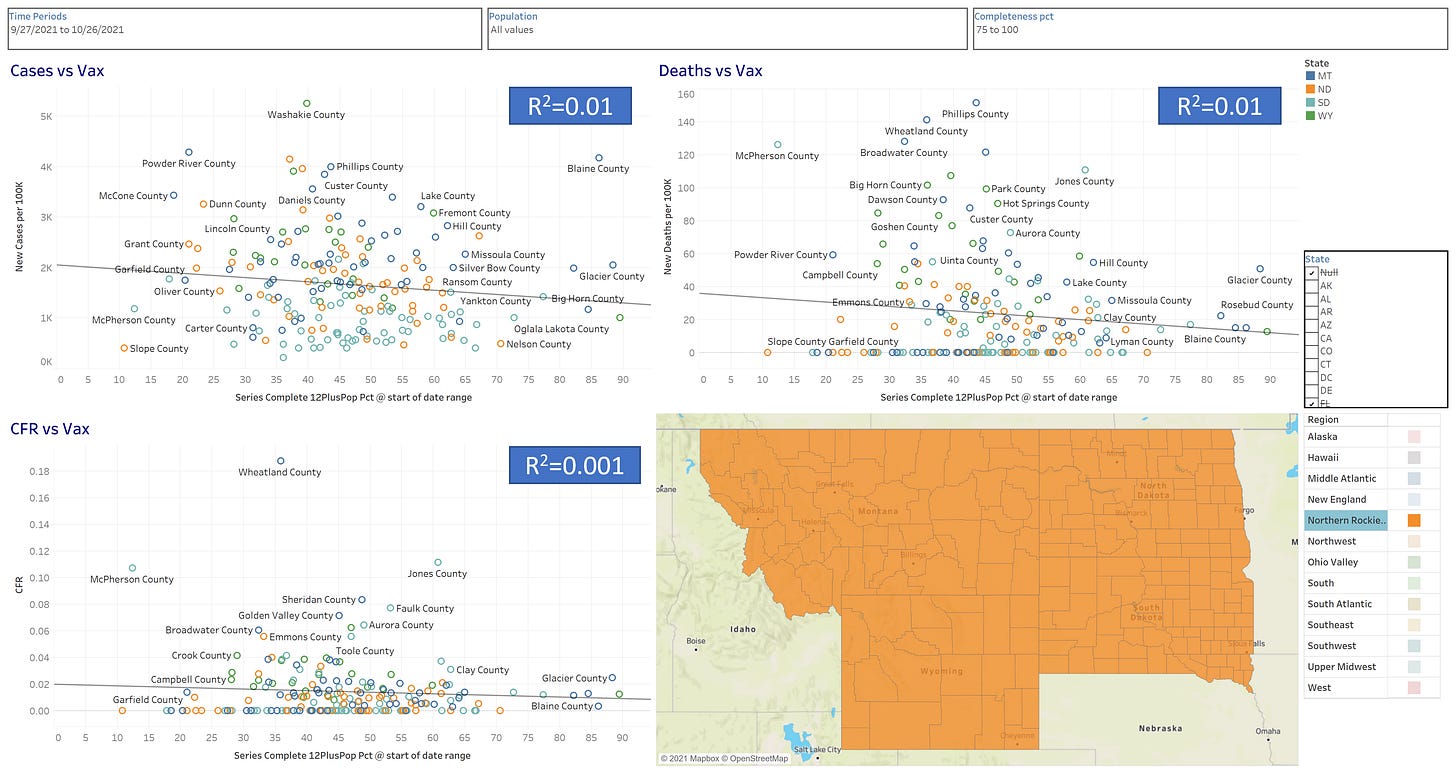
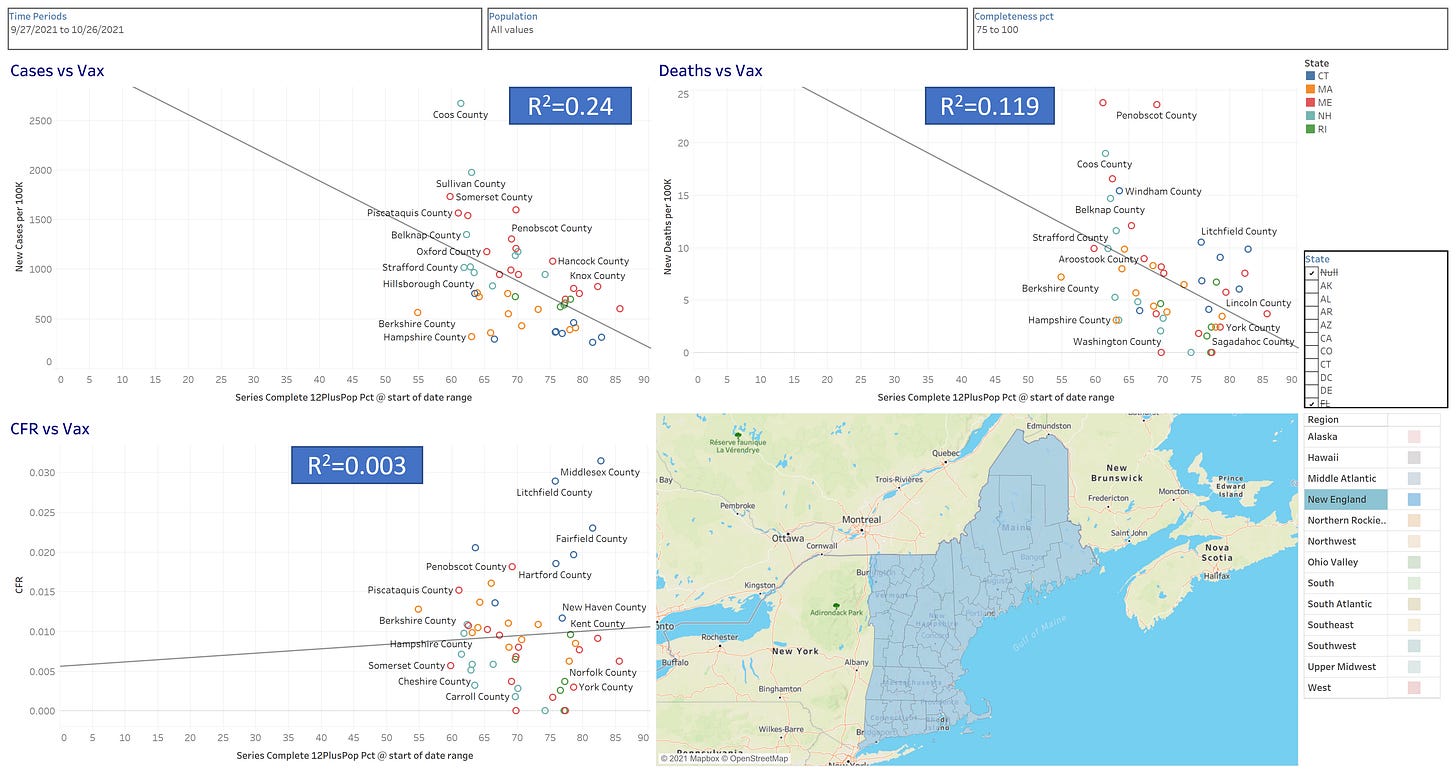
Below are each region’s scatter plots of vax rates vs. cases, deaths, and CFR for the previous month. The vax rate used is the fully vaxxed % of 12+ population at the start of the period (9/27/21). Several states (TX, NE, NJ, FL) have been removed because of obvious missing data (vax rate, deaths, and/or cases) at the county level. Only counties that reported 75% completeness of vaccination data were included. Moving around the country with some observations…
Northwest
Relatively good correlation between vaccination rates and cases/deaths, which then mostly disappears in CFR, which is where the relationship is expected to be strongest?
West
Nearly the exact same story as the Northwest, only higher correlation with cases and less with deaths. This is exactly opposite of what one might expect (i.e. would expect less impact on cases, more on deaths).
Southwest
Moderate to weak correlation across all three metrics. Vaccination rates may explain part of the outcomes in these four states, but clearly much more is in play.
Northern Rockies and Plains
Weak or no correlation. Outcomes in these states can’t be explained through vaccination rates.
South
Same.
Ohio Valley
Same.
Upper Midwest
Same.
Southeast
Slight relationship with deaths, weaker relationship with the other metrics.
Atlantic
Strong correlation with cases and deaths, moderate correlation with CFR. While this region, in isolation, would be good evidence for the effectiveness of vaccines, it would best show that they reduce transmission (cases), which has not been the primary selling point of late.
New England
Much like the Atlantic region, this shows fairly strong correlation with reduced cases, less impact on deaths, and essentially no impact on CFR (in fact, best fit slopes up). This can be seen as a positive story for vaccine, however not the story that’s most commonly told currently.
Summary
Of the ten regions, 5 showed pretty weak (if any) correlation at the county level between vaccination rates and cases/deaths/CFR. For the other 5, the correlation tended to be strongest in cases, next in deaths, and weakest in CFR. While interesting, this contradicts the narrative that the vaccines are not necessarily effective against infections, but protect against severe disease and deaths.


Thanks for assembling all of this.
Are we looking at all-cause deaths or just deaths attributed to COVID?