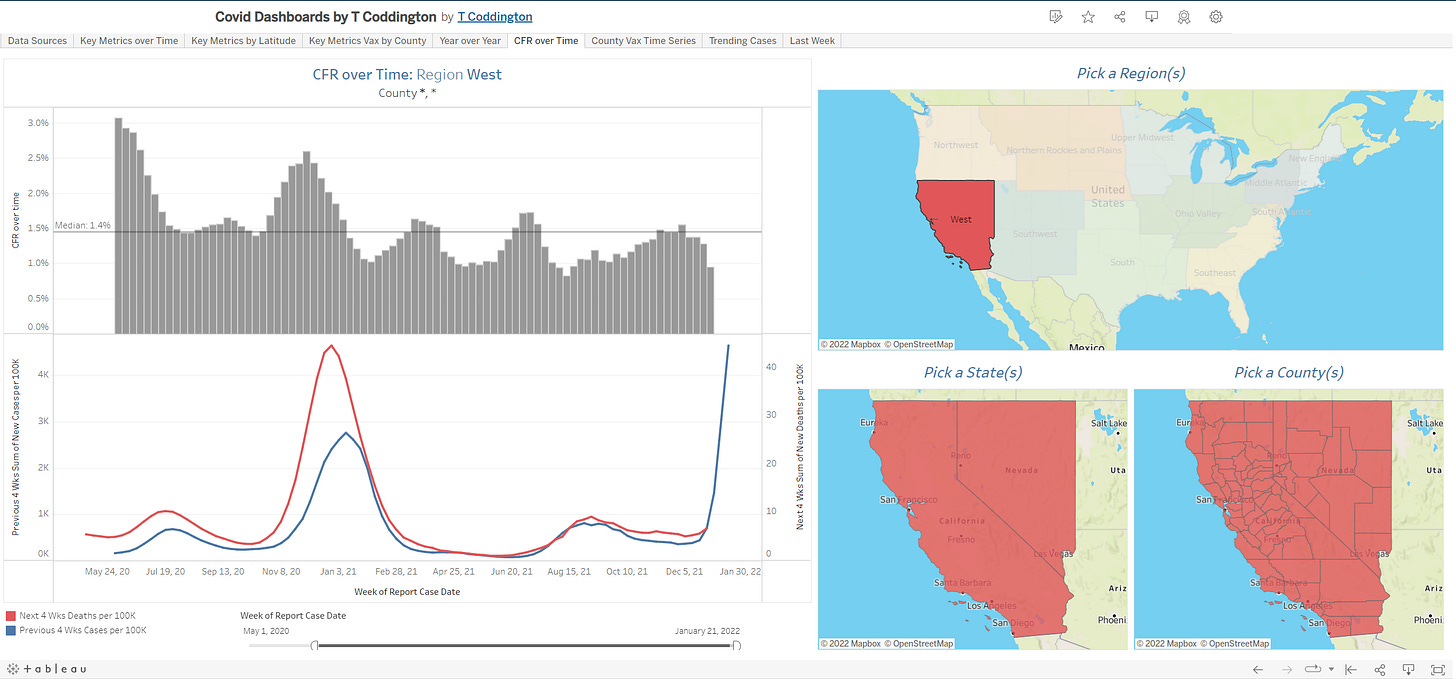
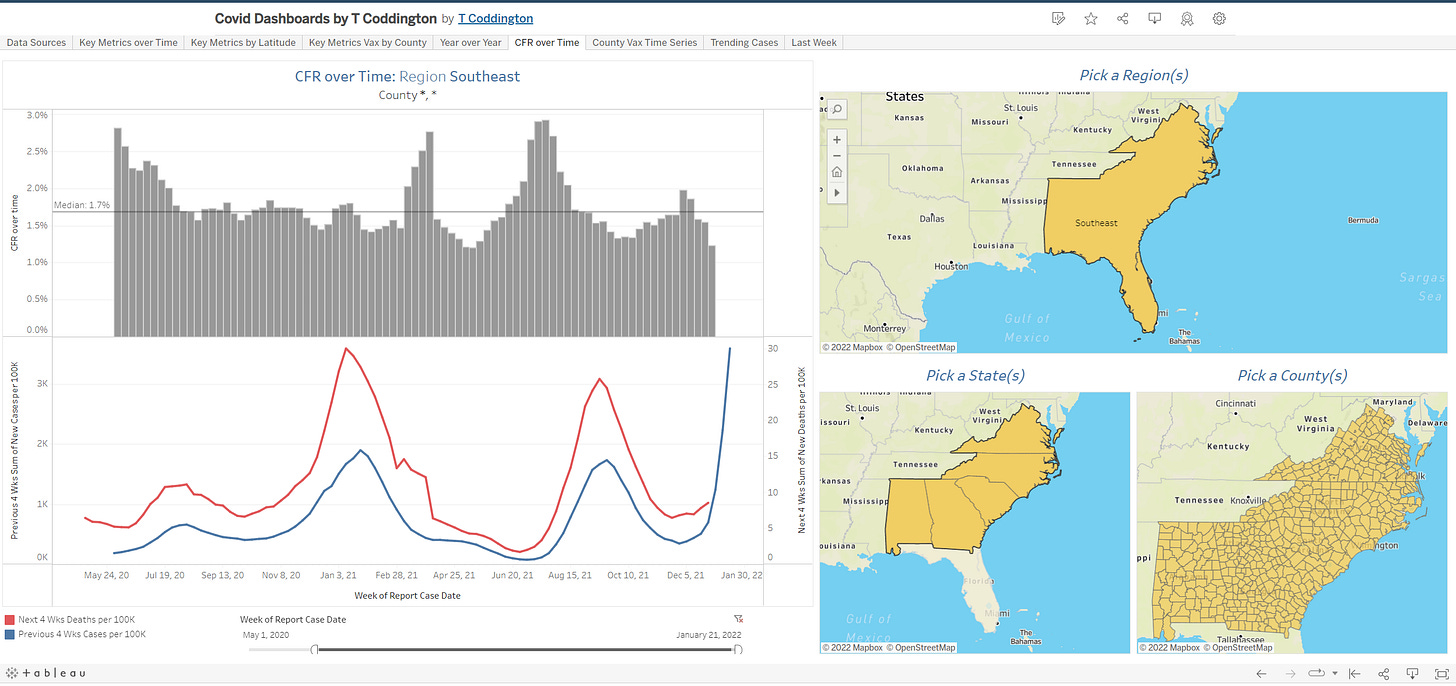
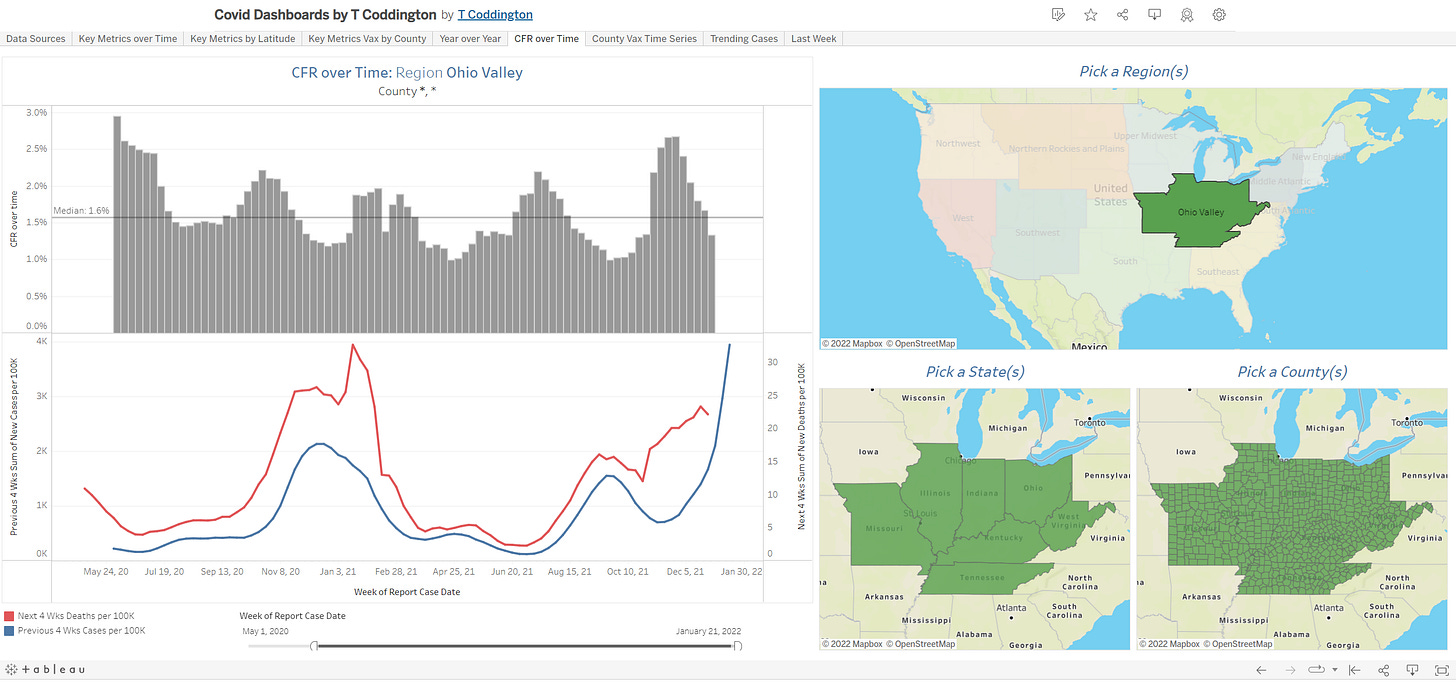
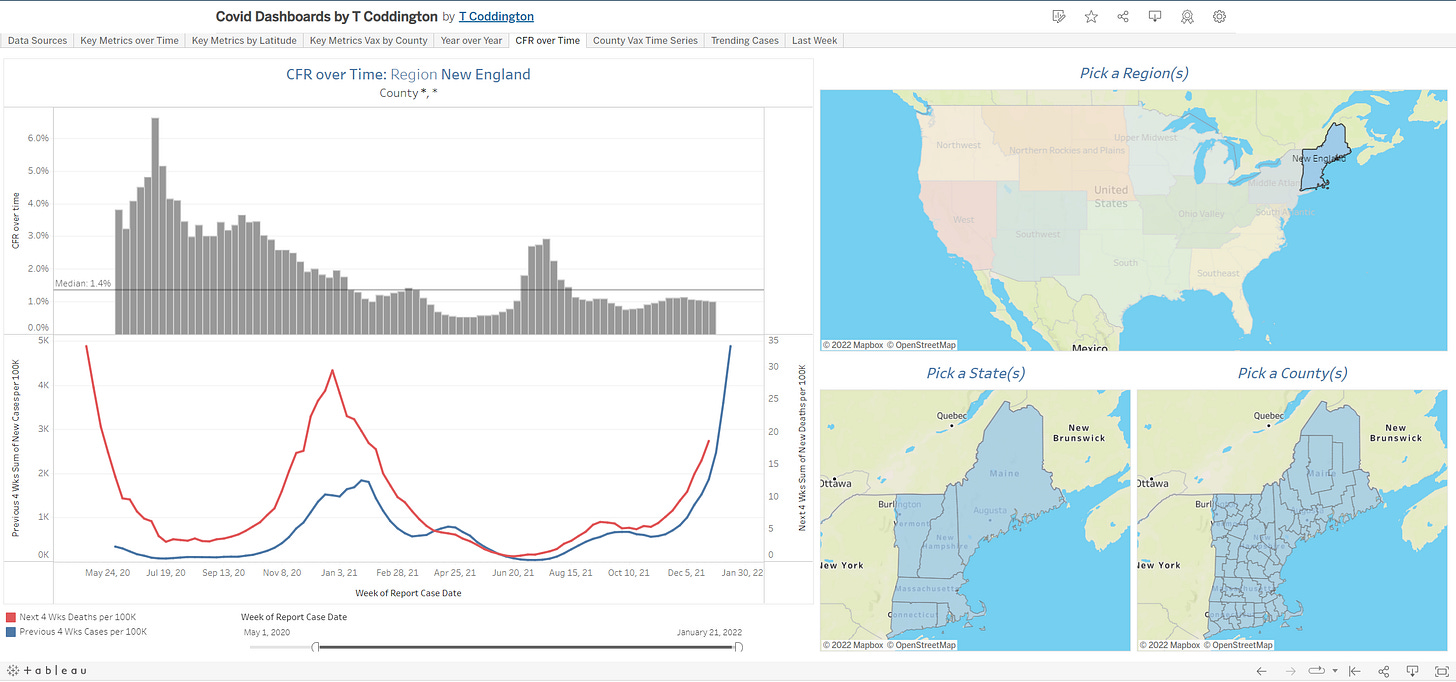
One of the tabs (“CFR over Time”) in the T Coddington Dashboards looks at cases & deaths (and thus Case Fatality Rate) over time (data source is USA Facts.org). Users can pick region(s), state(s), or county(ies) to see trends during different waves of the pandemic. Clearly people who die of COVID don’t do so immediately after contracting the virus, but rather weeks later. Therefore, it is helpful to shift the curves of the data by a few weeks to better align the case & death curves. The method I have used in my dashboard is, for any given moment in time, I plot the previous 4 weeks of cases vs. the ensuing 4 weeks of deaths. So, for example, if looking at week 48 of 2021, we would see the cases from weeks 44-47 vs. the deaths in weeks 48-51. This essentially means we assume a 4 week lag between an infection and a death.
Most regions of the country are currently experiencing record high infections. The hope would be that some combination of vaccines, better treatments, and a milder Omicron strain would mean that fewer infections would lead to deaths. Below we take a look at each major region of the country for evidence of this. Note, the curve for deaths ends on Dec 26 because we don’t have 4 forward looking weeks of data after that point.
Northwest
West
Southwest
Northern Plains and Rockies (minus Nebraska whose reporting lags)
South
Southeast (minus Florida who reports differently)
Ohio Valley
Upper Midwest
Middle and South Atlantic (minus New Jersey whose reporting is inconsistent)
New England
Observations
Generally, the patterns of cases (blue lines) and deaths (red lines) have moved in tandem over the last several months.
As a consequence of the above, if we focus on the data from Jan 2021 forward, it is not obvious that CFR has substantially reduced since the beginning of the vaccination campaigns.
CFR does look to be a bit lower in recent weeks in most regions. This may be a result of Omicron being less severe, or it may be that cases have grown so quickly that deaths have not yet caught up. The next few weeks will be very instructive.


I love your article for two reasons. One is that it is so well researched and you produced great graphs that really convey your point.
Another is that I have also been a proponent of "Omicron is not very mild" theory and wrote several articles to the same effect.
Looking at South Africa, the deaths have just crested a few days ago, whereas cases crested over a month ago on Dec 18.
This means that a 4 week delay may be very appropriate. Omicron causes delayed deaths such as heart attacks a couple of weeks post-"recovery".
Regarding the "Omicron is mild and will end Covid" theory. My own opinion is that it is NOT very mild and it will also NOT end Covid. The other Omicron variant called Ba.2 is catching up and is already dominant in Denmark, causing further insane increase in cases curve there. Cases also stopped falling in the UK and are rising again. The reason is that the UK is a couple of weeks behind Denmark on Ba.2. We are 4 weeks behind Denmark.
https://igorchudov.substack.com/p/ba2-omicron-variant-is-worth-discussing
Most likely Ba.2 is reinfecting the recently recovered vaccinated people, giving covid on top of covid on top of booster.
One of the basic truths that has seemed to evade all our 'experts' is this:
If 10% of your population has a virus, roughly 10% of your deaths will have that virus -- even if it had nothing to do with why they died.
So as the positive rate ticks up, deaths will follow because of the stupid way we count covid deaths.