A couple months ago I addressed the topic of whether there was concerning data in the UKHSA reports regarding vaccines in pregnant women and the rate of stillborn births compared to unvaccinated women:
Since that time, subsequent reports have included updated data. In this post, I will look at how some of the key metrics changed over time & whether that provides additional reasons to be concerned.
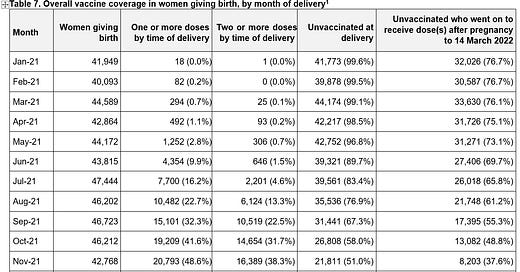
The week 12 UKHSA report provides information on the number of births by vaccination status and month in 2021:
Through the week 11 report, we knew this about stillbirth rates:
So, given that there were 79,777 births among the “one or more doses” and 405,272 births among the unvaccinated in Jan-Nov, we can calculate (using the 3.63 per 1,000 and 3.90 per 1,000 rates) there were 290 stillborn births among the vaccinated & 1,581 among the unvaccinated in Jan-Nov timeframe.
Next, we see in the week 12 report, updated rates to include December:
Using the 3.78 & 3.90 rates and applying to the entire year’s births of 102,089 and 424,301 for vaccinated and unvaccinated women respectively, we calculate a total of 386 stillborns among the vaccinated and 1,655 stillborns among the unvaccinated for Jan-Dec 2021.
Here is where it gets interesting, and potentially troubling. If I subtract the Jan-Nov numbers from the Jan-Dec numbers, I should get just the stillborns that happened in December. For the vaccinated, 386 stillborns for all of 2021 minus 290 in Jan-Nov implies 96 stillborns in Dec. For the unvaccinated, we have 1,655-1,581=74. Now, I take the 74 stillborns among the unvaccinated and divide by the 19,029 births in December and I get a rate of 3.89 stillborns per 1,000 births… basically the same as the 3.90 we have been seeing all year for the unvaccinated. For the vaccinated, I take the 96 stillborns and divide by the 22,312 December births and I get a rate of 4.30 (~11% higher than unvaccinated). That is a big jump from previous months, and as we explained in the previous posts on this topic, because of the time of vaccination in pregnancy, we should expect vaccinated women to have a lower rate of stillborns, somewhere in the 33% lower range (please read previous posts if you have not… don’t need to rehash entire argument here). ***Update: see below note and new post for why this 33% may not be appropriate for December. I am not deleting the previous sentence as I want to be honest about my mistakes and not distort the record.
Would love some peer review, please check my math. Also possible that some aspect of the frequency of how & when they report these numbers is causing a problem with the approach I’ve taken above. It would be most welcome if the UKHSA shared the raw, detailed data so that we wouldn’t need to try to infer these things. I went down this track today because I saw that the full year rate for vaccinated women had jumped from 3.63 to 3.78 & I thought “wow, that’s a lot to jump in one month, December must have been terrible.” The powers that be obviously have the information to support or refute that. I am doing the best with the data available to me, and from what I can see, December should be setting off alarms on this topic.
***See new post which identifies a weakness in the above. Thanks Brian Mowrey for pointing this out.


Thanks for the update.
While the math that leads to "somewhere in the 33% lower range" might not have changed much for the overall timespan, it probably doesn't apply to the discrete rate for December - it seems unlikely that as many pregnant women would have put off injection until October or later rather than having already made their decision by then.
I fear you are correct . I have tried to make sense of the data and it feels off. Much like the NEJM study some time ago; I think they conflate different time periods and status.
Not sure I can prove it (yet) but I think they may take overall % vaccinated at end of Dec and rate the outcomes against that %, rather than chart a moving picture. A pregnant and jabbed women at first tri is not the same as at final tri. And nor can they give the same data as to full term etc etc
What might be the tell is looking at the reports over the last few months and trends.
For example, if I recall correctly, % low birthweight was higher for those initially vaccinated ~ 12 weeks ago yet is now lower/the same as for unvaccinated. This does not compute if everything else is equal.