Republicans are for the Rich?
While it is common nowadays for me to forget things that happened last week, strangely certain memories from many, many years ago stick with you. I distinctly remember a high school social studies teacher of mine in the early 90’s explaining to the class that (paraphrasing), “Republicans are really for wealthier people, while Democrats are for more common people.” While I’m quite confident the political biases of school teachers are even more freely shared today, that is not the topic of today’s post. I was reminded of this teenage experience while watching a clip of RFK Jr.’s interview with Tucker Carlson in which he talks about the realignment of the parties in recent years.
It seemed relatively clear to me that Democrats have become the party of the wealthy, but people can be fooled by the bubble they live in, so I wanted to examine the available data to see just how true this was. To do so, I looked to examine the US County level voting patterns in 2020 and mesh it with data on income levels by county.
Data sources:
Voting results: MIT Election Data and Science Lab, 2018, "County Presidential Election Returns 2000-2020", https://doi.org/10.7910/DVN/VOQCHQ, Harvard Dataverse, V12
Demographic data: US Census
I categorized the US Counties into income levels (Median Household Income) by $10K increments. Then, I calculated the overall % of the vote that went to Trump, the % of voters who cast a vote (estimate based on votes cast & total population - population of 15-19 year olds…. yes, I know 18-19 year olds can vote, but that’s the age population bracket I had handy & close enough 😉).
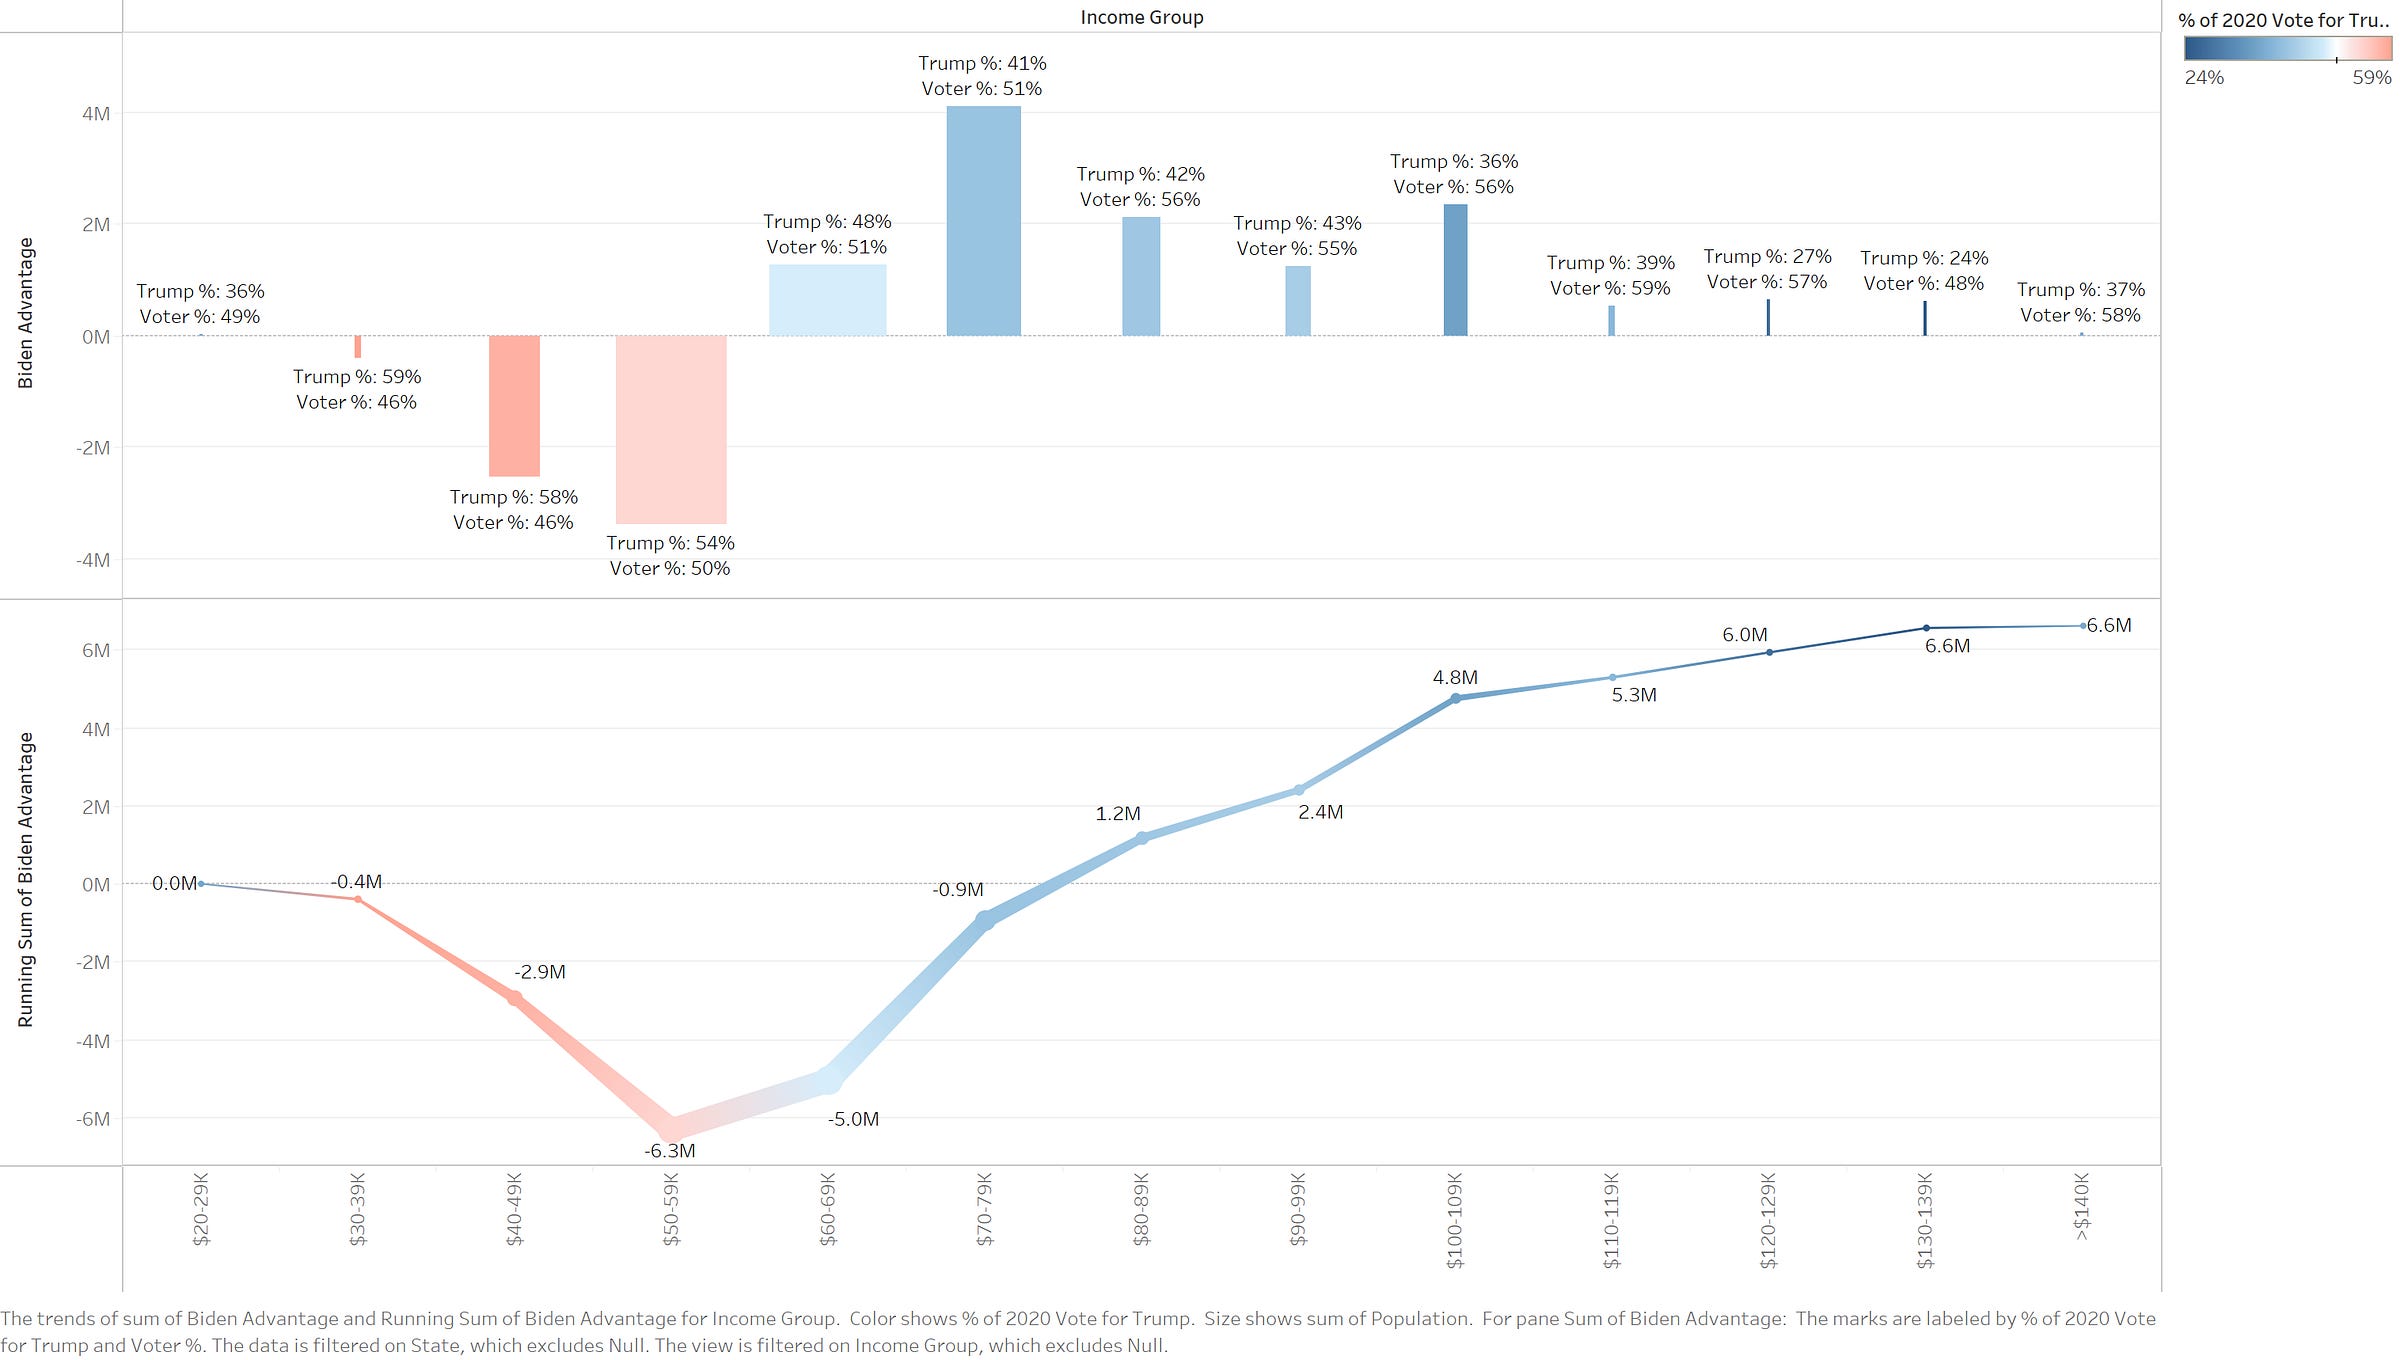
Chart Description:
Top half: by income bracket we see,
Population in counties of that income bracket denoted by width of bar
% of votes in those counties for Trump (1st label as well as deep blue → deep red color scale)
% of voting population who voted, 2nd label
Bottom half:
This is a running total of Biden’s advantage in total votes across income levels (negative means Trump had an advantage)
Width of line indicates population size at that income level
Color of line as above
Observations
As intuition (and RFK Jr.) stated, the idea that Democrats are for the working class folks is a very outdated notion. The % of votes for Trump essentially fall with every increase in counties’ household income. The very lowest income bracket ($20-29K) is heavily Biden (these counties are ~59% african american, which the Dems obviously still dominate) and at there is an increase in Trump’s % when going from $130-139K to >$140K, but that last group represents a single county (Loudoun, VA). For all groups $30K up to $139K, the higher household income your group of counties had, the larger advantage Biden had in that group of counties.
In counties where median household incomes were <$60K (pop. ~119M), Trump held a 6.3 million vote advantage, in counties with income >$60K (pop. ~211M), Biden’s advantage was 12.9 million, resulting in his total advantage of 6.6 million votes.
Also of note is the voter participation differences. Counties with incomes above $80K voted in far greater numbers than others, generally.
Conclusion
Post is not intended to advocate for one candidate vs. the other. My impression is that many (most?) people’s anchored belief aligns with my old social studies teacher, while the data tells a completely different story. Seems like acknowledging this reality and trying to understand it might benefit public discourse. I won’t hold my breath.
As for me, my situation is described best by a meme that Gato posted (I think) 🤣:


