


How similar will all states be in COVID deaths when this is over?

Ran across this tweet from Prof. Levitt earlier today:

The last sentence struck me as something to look at further. As we think about the rate of COVID deaths within a particular geography, we should be putting those numbers in the context of the amount of “natural death” in that same geography. This is a similar idea to the one explored here, where we saw that places where people die often of COVID tend to be the same places where people die often of other reasons (i.e. “natural deaths” in Prof. Levitt’s wording).
One simple way of exploring this is to simply look at what % of a given area’s total deaths in 2020-21 were labeled COVID deaths. This metric would naturally account for the fact that different places had different non-COVID death rates, presumably due to demographic factors, general health, environmental factors, etc. Because different geographies are at different points of the seasonality curves, I believe it will be useful to look at this by regions. These charts will show a line for each state, showing what % of the cumulative total deaths since Jan 2020 are labeled COVID Deaths:

Middle Atlantic: NY & NJ are essentially identical. Both are a bit higher than PA, driven by their huge spikes early in the pandemic. This may have been driven by poor knowledge of how to treat the severely ill early on… perhaps this means PA will never “catch up” to them in terms of relative deaths.
New England: CT, RI, and MA are tightly coupled, with %’s between 11.8% -13.3%. On the other hand, NH, ME, and VT have very low %’s. One has to wonder if there is something to their being at the extreme corner of the country geographically that is in play.
South Atlantic: MD & DE are essentially identical.
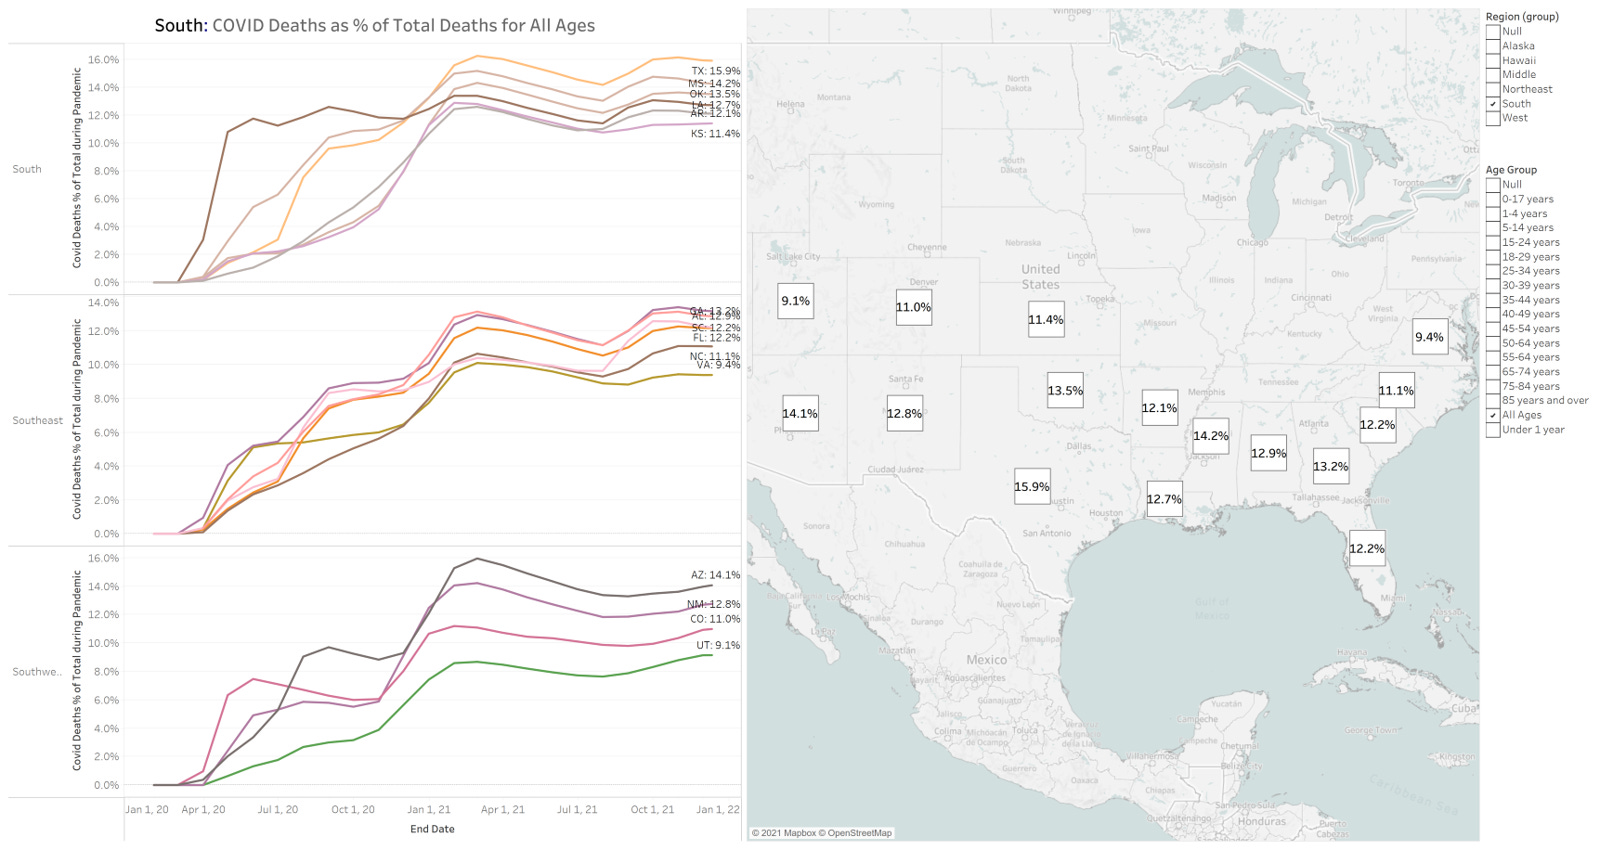
South: The range of values among these six states is 11.4%-15.9%. TX seems a bit high, while KS (the northernmost of these states) has the lowest value. AK, OK, MS, and LA are all very similar.
Southeast: VA (northernmost of these states) has the lowest % of COVID deaths, with NC (2nd most north) the 2nd lowest. FL, GA, AL, and SC look remarkably similar.
Southwest: From lowest value to highest, we have UT, CO, NM, and AZ. Again, the more northern states have lower %’s of COVID deaths. In addition, I believe age is likely coming into play here for UT. Although COVID deaths vs. other deaths are similar proportionally at the older ages, younger folks are particularly unlikely to die of COVID vs other causes. Namely, ~4% of all deaths are among <35 year old people, but only 1% of COVID deaths are <35. UT has a very high under 35 population (55% of their pop) whereas the other states here are only ~45-46%.

Northern Rockies and Plains: Very similar overall. The Dakotas had a very big spike last winter, possibly explained by their very high number of nursing home residents (nursing home residents generally being the most vulnerable population). MT & WY virtually identical. NE a bit lower at the moment.
Ohio Valley: WV is the lowest, the rest (OH, KY, TN, IN, IL, MO) are bunched tightly together.
Upper Midwest: IA (another large nursing home pop state) is a bit above the others, while MN, MI, and WI are pretty comparable.

Northwest: ID is significantly higher than WA & OR. In fact, ID would look very similar to MT & WY, which perhaps is a more appropriate group for comparison. OR & WA look very similar and have low rates that are only approached by our trio (ME, NH, VT) in the extreme NE. The fact that OR & WA are in the other northern corner of the country seems relevant. Guess we will have to wait and see.
West: NV and CA are very similar.
Trying to get a sense of the variability across the country, I created this histogram where states are categorized into what % of total 2020-21 deaths are labeled COVID deaths. Total population of each column is at the top:

Observations:
~200 million people live in states with % of COVID Deaths between 10 & 13%.
States on the very low side tend to be geographic extremes:, VT, HI, ME, NH, OR, WA.
As we saw above and reinforced here, states within a region tend to have similar numbers.
Will be interesting to see if the variability continues to narrow as we (hopefully) get through the last waves of this pandemic.
Speaking to your point, check out NY state hospitalization by individual region. The trend is clear: If you had a big event in spring 2020, your winter 2020 was muted. If you had a small event in spring, you got hit hard in the winter.
https://coronavirus.health.ny.gov/daily-hospitalization-summary
Also, speaking to Washington state: bloodwork shows 2.1% of donations had antibodies -- in Mid-December 2019, long before we did anything at all to slow the spread (and before testing). It's extremely likely the virus came through in flu season and we didn't even notice because old and/or sick people die all the time during flu season.
There's evidence that severity track absolute humidity... https://www.zerohedge.com/covid-19/theory-why-covid-cases-started-skyrocketing-central-europe-last-month
I'm in Marin County, CA, and it does look like cases track temperature, which should be related to humidity (and I haven't found an absolute humidity history).
If you check cases at https://coronavirus.marinhhs.org/surveillance versus temperature in 2020 at https://weatherspark.com/h/y/529/2020/Historical-Weather-during-2020-in-Marin-City-California-United-States#Figures-Summary it seems to track peak temps.
We've had a very mild winter so far, just started getting colder recently, and now cases are climbing vs weather at https://weatherspark.com/h/y/529/2021/Historical-Weather-during-2021-in-Marin-City-California-United-States#Figures-Temperature
Of course Omicron could also be a factor, but cases do seem to follow the temps with just a visual check.