Following up on my previous post…
Wanted to look at excess deaths by age group and season. Primary data source, from CDC: Weekly Counts of Deaths by Jurisdiction and Age . Since different areas have different seasonal trends, I think it’s important to try to account for that in my analysis. To do so, I split the years into Spring→Fall season (March-Oct) and Winter season (Nov-Feb). At a high level, this basically corresponds to the idea of a Flu season and a non-Flu season (although specific definition of Flu season shifts year to year). This grouping also has the benefit of basically coinciding with when COVID 1st started making an impact on deaths in the US (Mar 2020) and when vaccines would have been expected to start making impact in US (Mar 2021.. some may argue earlier, but Our World in Data shows ~10% of US was fully vaccinated by Mar 2021). The age groups are defined in the CDC data, I don’t control that.
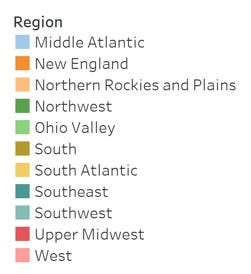
In the data that follows, I will show the excess death % (calculated over the previous 5 years death rate in the state during the corresponding season) by age group and state, vs. the % of that state’s population vaccinated as of now (really as probably a couple weeks ago when I lasted grabbed it… can’t have changed in any meaningful way). Best viewed on large screens. Colors are the Region of State:
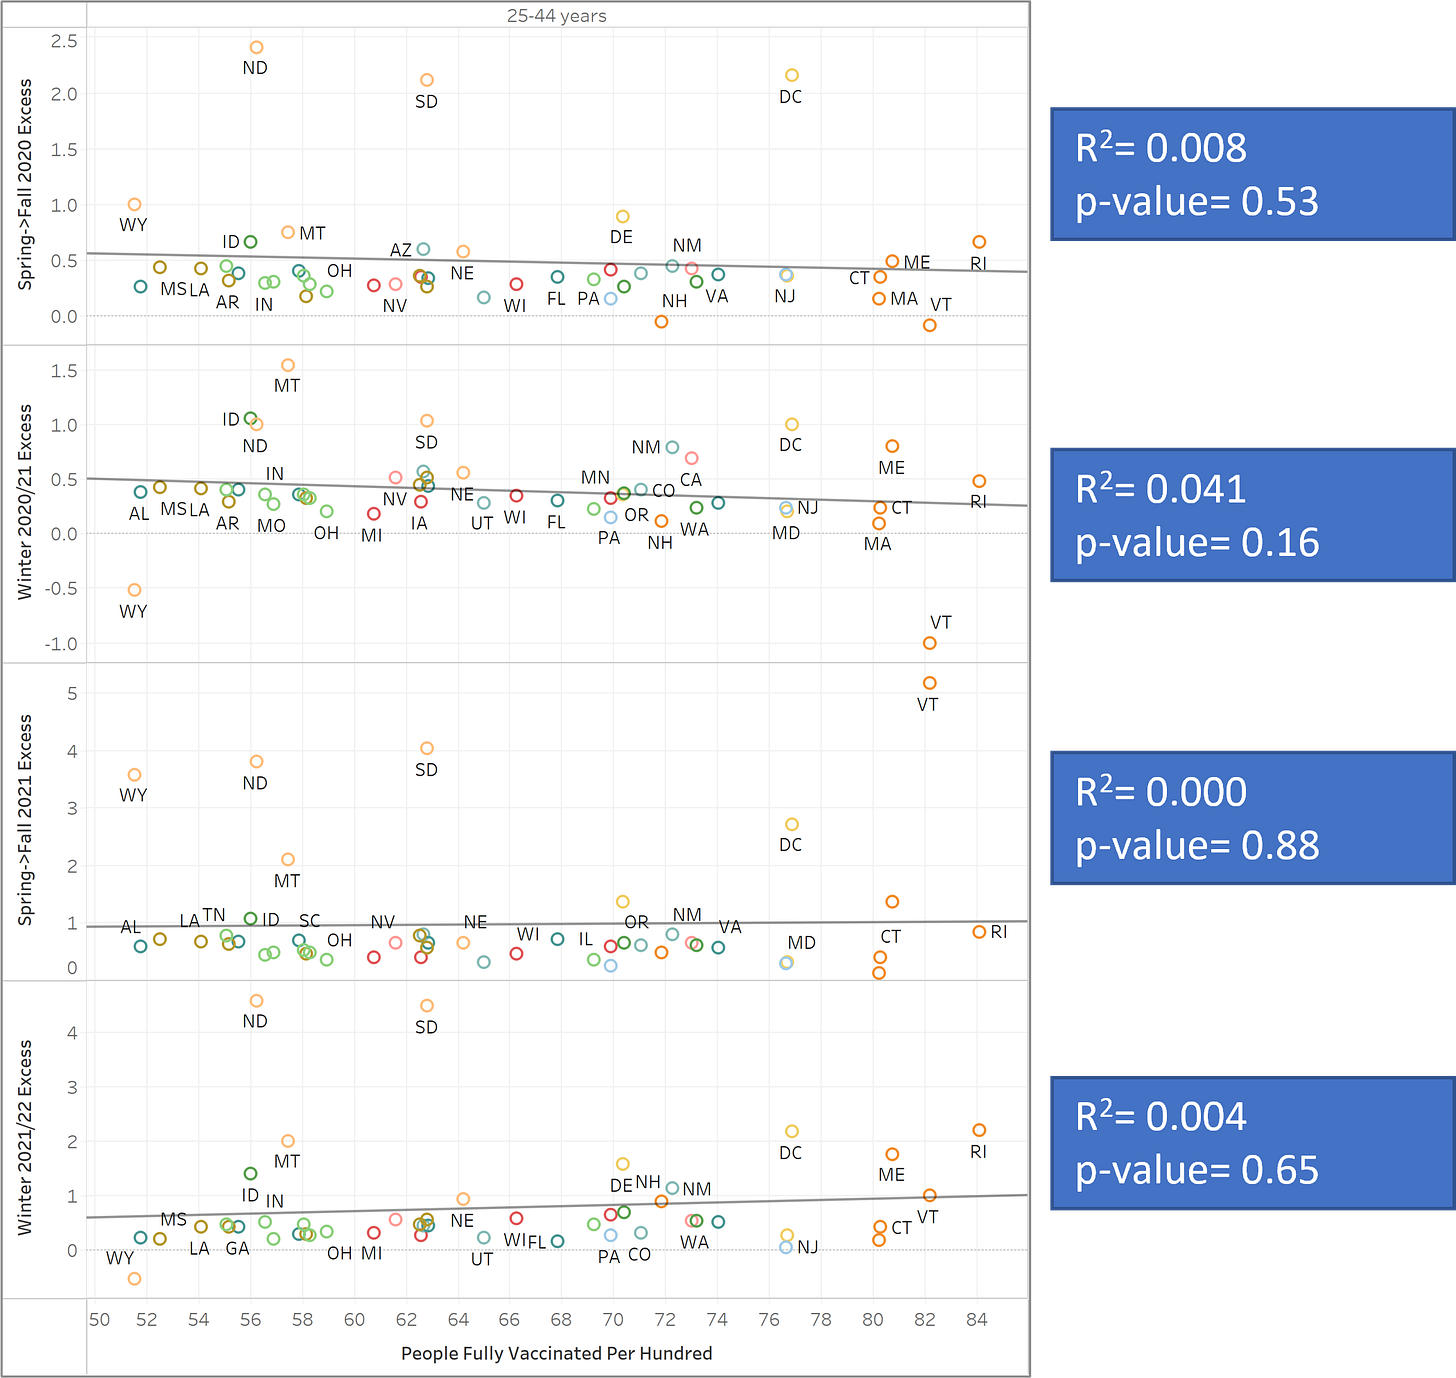
Age 25-44
No statistically significant relationship between a state’s vaccination rate (in summer 2022) vs. excess death rates in any of the four seasons analyzed.
Age 45-64
No statistically significant relationship between a state’s summer ‘22 vaccination rate vs. excess death rates in Spring->Fall 2020 (as should be expected as this was pre-vaccine). Moderate correlation found in Winter 2020/21 when vaccines 1st rolled out. Strong correlation in Spring->Fall 2021. No correlation in Winter 2021/22. As a side note, this is the age group I would tend to trust the least in terms of a possible Simpson’s paradox. It covers 20 years & there is a large difference in the risk of COVID between a 45 year old and a 64 year old.
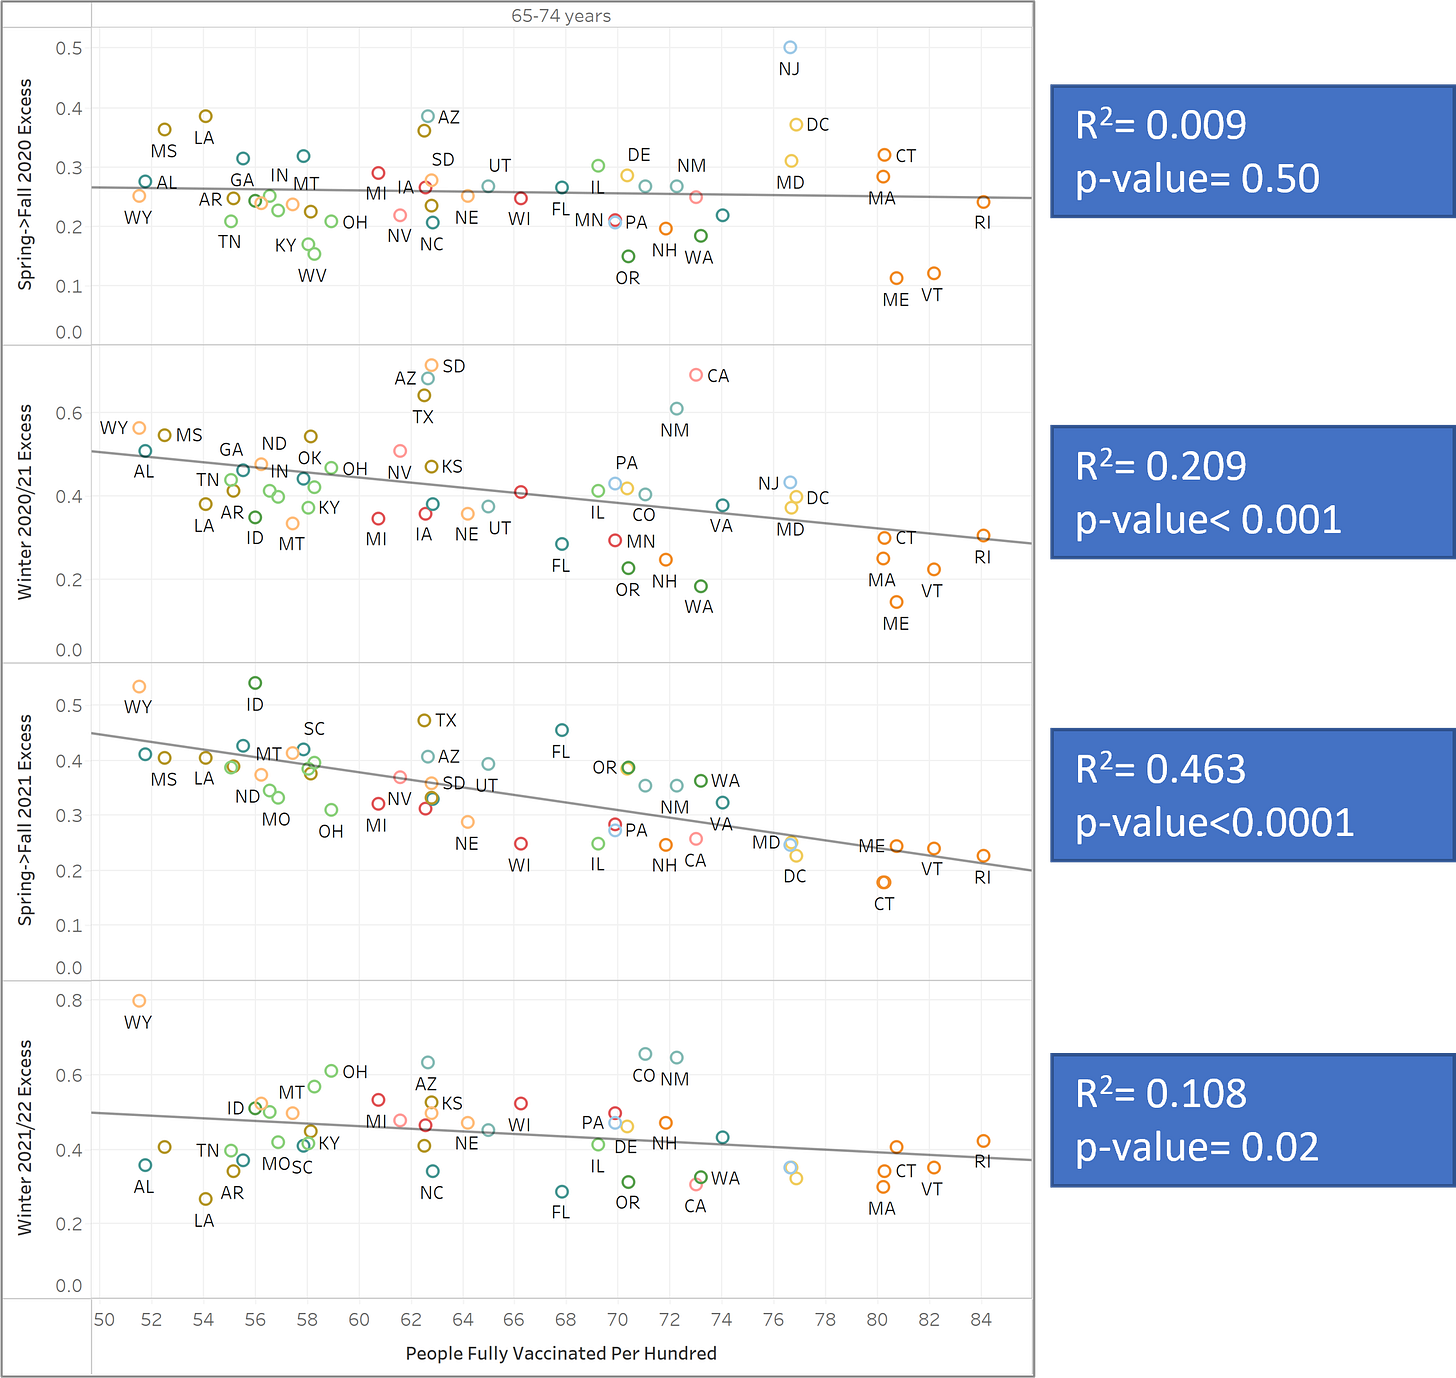
Age 65-74
No statistically significant relationship between a state’s summer ‘22 vaccination rate vs. excess death rates in Spring->Fall 2020 (as should be expected as this was pre-vaccine). Strong correlation found in Winter 2020/21 when vaccines 1st rolled out. Very strong correlation in Spring->Fall 2021. Moderate correlation in Winter 2021/22, but much weaker than previous season.
Age 75-84
No statistically significant relationship between a state’s summer ‘22 vaccination rate vs. excess death rates in Spring->Fall 2020 (as should be expected as this was pre-vaccine). Strong correlation found in Winter 2020/21 when vaccines 1st rolled out. Moderate correlation in Spring->Fall 2021. No statistically significant correlation in Winter 2021/22.
Age 85 and older
No statistically significant relationship between a state’s summer ‘22 vaccination rate vs. excess death rates in Spring->Fall 2020 (as should be expected as this was pre-vaccine). Strong correlation found in Winter 2020/21 when vaccines 1st rolled out. Moderate correlation in Spring->Fall 2021. No statistically significant correlation in Winter 2021/22.
Observations
No correlation between vaccination rate by state and excess deaths for <45 years old in any season.
Only the 65-74 year old group showed statistically significant correlation in the most recent Winter season (Nov 21-Feb 22).
All four age groups above 45 show statistically significant correlation between increased vaccination and reduced excess death % for Winter 20/21 and Spring→Fall 2021.
The older two of these groups (75-84, 85+) showed higher correlation in Winter 20/21 vs. Spring→Fall 21
The younger two of these groups (45-64, 65-74) showed lower correlation in Winter 20/21 vs. Spring→Fall 21
The previous 2 bullets would be consistent with the idea that the rollout of the vaccines went to the oldest groups 1st & therefore those groups benefited earlier (Winter 20/21) and the subsequent age groups benefited more in the next season (Spring→Fall 21).
Points 2 & 3 generally leave me still considering (modified versions) of possible hypotheses of last week’s post:
Vaccine was effective against infection (and therefore deaths) in the pre-Omicron days. Post Omicron, the vaccine no longer appears protective against infection (or death).
Significant VE fade over months. In this scenario, it’s less about the variant and more about the fact that the efficacy fades over time. This would be consistent with correlation present in excess dates in Winter 20/21 through Spring→Fall 2021, but then seeming to disappear (or greatly reduce in the case of 65-74 year olds) in Winter 2021/22.
Final Thoughts
I suspect there is a segment of my readers who will see this post as being too supportive of the vaccines. I would just like to reiterate that my goal is present & analyze data in a fair and honest way. I think it’s been clear throughout my writing that I am not someone who blindly accepts the marketing material of the pharma companies or the reporting of the public health organizations, etc. Doing my best to critically examine these issues and not let my biases (we all have them) cloud my judgement.


Did you correct for the 2 weeks post-shot listed as unvaxxed issue?
Could account for results that seem to contradict much of the latest evidence coming out, ie, vaxxed are getting the 'Vid and dying at a higher rate than unsjabbed.
The VAERS data for death has a non-random skew towards older vaccinees ( ages 55+); with highest reports by day of onset not reflecting a background pattern