The UK provides better reporting of cases, hospitalizations, and deaths with regards to vaccination status than the US. Unfortunately, the data is embedded in tables inside of pdf’s. The excellent @eugyppius has several posts on this data, including an explanation of how the UK seems to be attempting to possibly conceal or diminish data unfavorable to the vaccines.
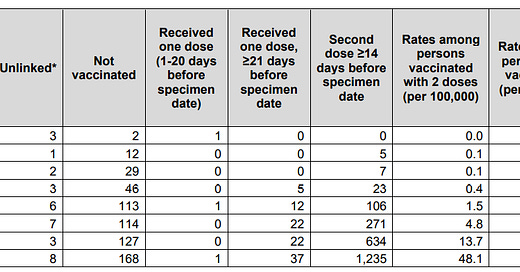
In this post, focus will be on looking at vaccine efficiency against death within 28 days of a positive COVID test among the vaccinated and unvaccinated. Each report contains data for a 4 week span and is produced weekly, meaning there is overlap of 3 weeks for successive reports. This examination covers reports detailing time windows: Weeks 32-35, Weeks 33-36, …. Weeks 41-44 (10 reports in total). The table from the reports looks as follows:
Note that in recent weeks, the last two columns (the ones we will focus on here) have been split into a different table.
The last two columns allow us to compare the rate of death among vaccinated and unvaccinated individuals by age group. For example, we see that for the 80+ in this report, unvaccinated are 2.8x more likely to die than the vaccinated. This implies a Vaccine Efficacy against death for this age group during this time period of ~74%.
A natural question is how does this ratio look of time? If the vaccine efficacy is holding up, then we might expect some bouncing around from report to report, but no clear pattern. So, let’s look at the numbers across these 10 reports:
Uh oh. For each age group (only plotted above 40 as death rates below that age are so low that ratios of small numbers become unstable) we see a pretty consistent pattern of the ratio declining, which implies declining protection against death from the vaccine over time. Note also, by nature of the reporting (overlapping 4 week intervals), what we are seeing are essentially moving averages & therefore the weekly decline would look more dramatic if we had individual week numbers (*** note, I think there is a way for me to back out the weekly numbers, but it will take a little work).
Looking just at the ratios of the 1st report included, Week 36 report (covering Weeks 32-35) vs Week 45 report (covering weeks 41-44), we see the following reduction in vaccine efficacy:
40-49 yr old: 51%
50-59 yr old: 40%
60-69 yr old: 39%
70-79 yr old: 40%
80+ yr old: 33%
Major question in my mind is whether there is a floor of VE, or whether it will eventually hit zero. Stay tuned, I will look to update this in coming weeks as more data is reported.


What jumps out at me is that the vast majority died within 2 weeks after being double vaxxed.
Actually instead of hitting the floor of zero, note that there is NO FLOOR at all.
For VE against illness, in the UK that is already deeply negative. VE against death may also become deeply negative.