In a previous post it was observed that (at least visually) that there appeared to be a rising number of non-COVID Emergency Department visits at the same time as an increasing number of people had received their 1st shot of a COVID vaccine. In that post, caution was encouraged at drawing any major conclusions based on some unknown factors. Namely…
This is the mother of all limitations … The hospital data does not include prior years and your humble author knows nothing about typical year emergency room visits. If any readers can point me to data, or expert knowledge on this, please do. All states show rising non-COVID ED visits from February through July (or thereabouts). This may be the case every year.
Examining a new data set, however, might give a clue as to the severity of this limitation. In the search for data on Emergency visit seasonality, one wonders if a possible source of multi-year data is Google Trends. Logic would suggest that if a person thought they needed to go to an emergency department (or to visit someone there), they may google to see where they should go. The idea then is to see if Google Trends can be used to determine if the recent months sharp rise in ED visits is unusual, or part of a standard seasonality.
The analysis consists of two steps:
Determine whether actual ED visits are correlated with Google searches for “Emergency Room” … i.e. is it reasonable to expect the Google data to be reflective of actual physical visits.
If the correlation in (1) does look meaningful, look to see if previous years show the same seasonal pattern as we see in 2021.
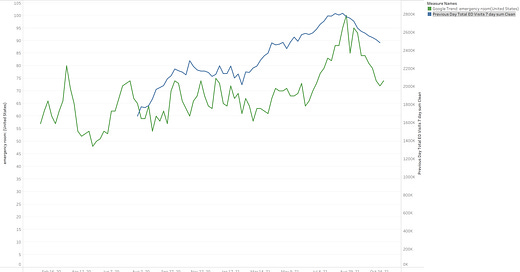
Step 1: Plot ED Visits vs. Google Trend (“emergency room”, United States).
The blue line is the total ED visits, while the green line is the Google Trend score. Looks to be sufficiently correlated to move on to step 2.
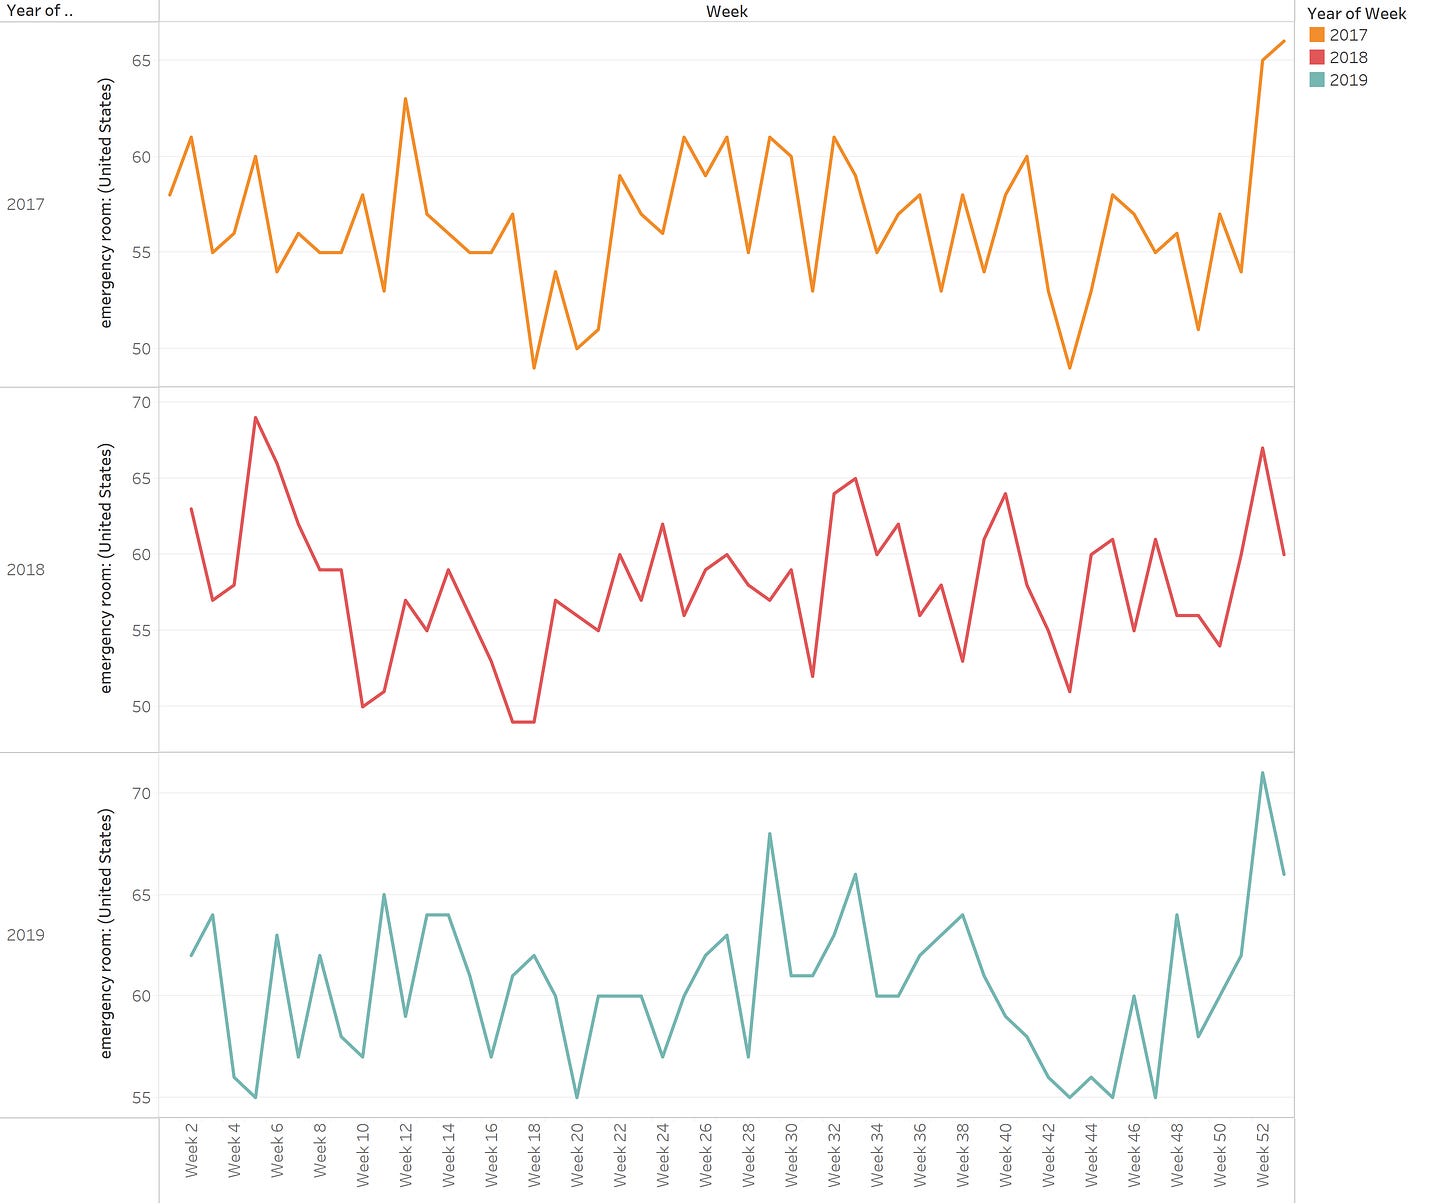
Step 2: Plot Google Trends for multiple years to examine if seasonal patterns emerge.
Starting with 2017-2019 (pre-COVID years)
No particular pattern emerges to the author’s eye, other than perhaps higher rates at the very end of the year (New Years Eve accidents?).
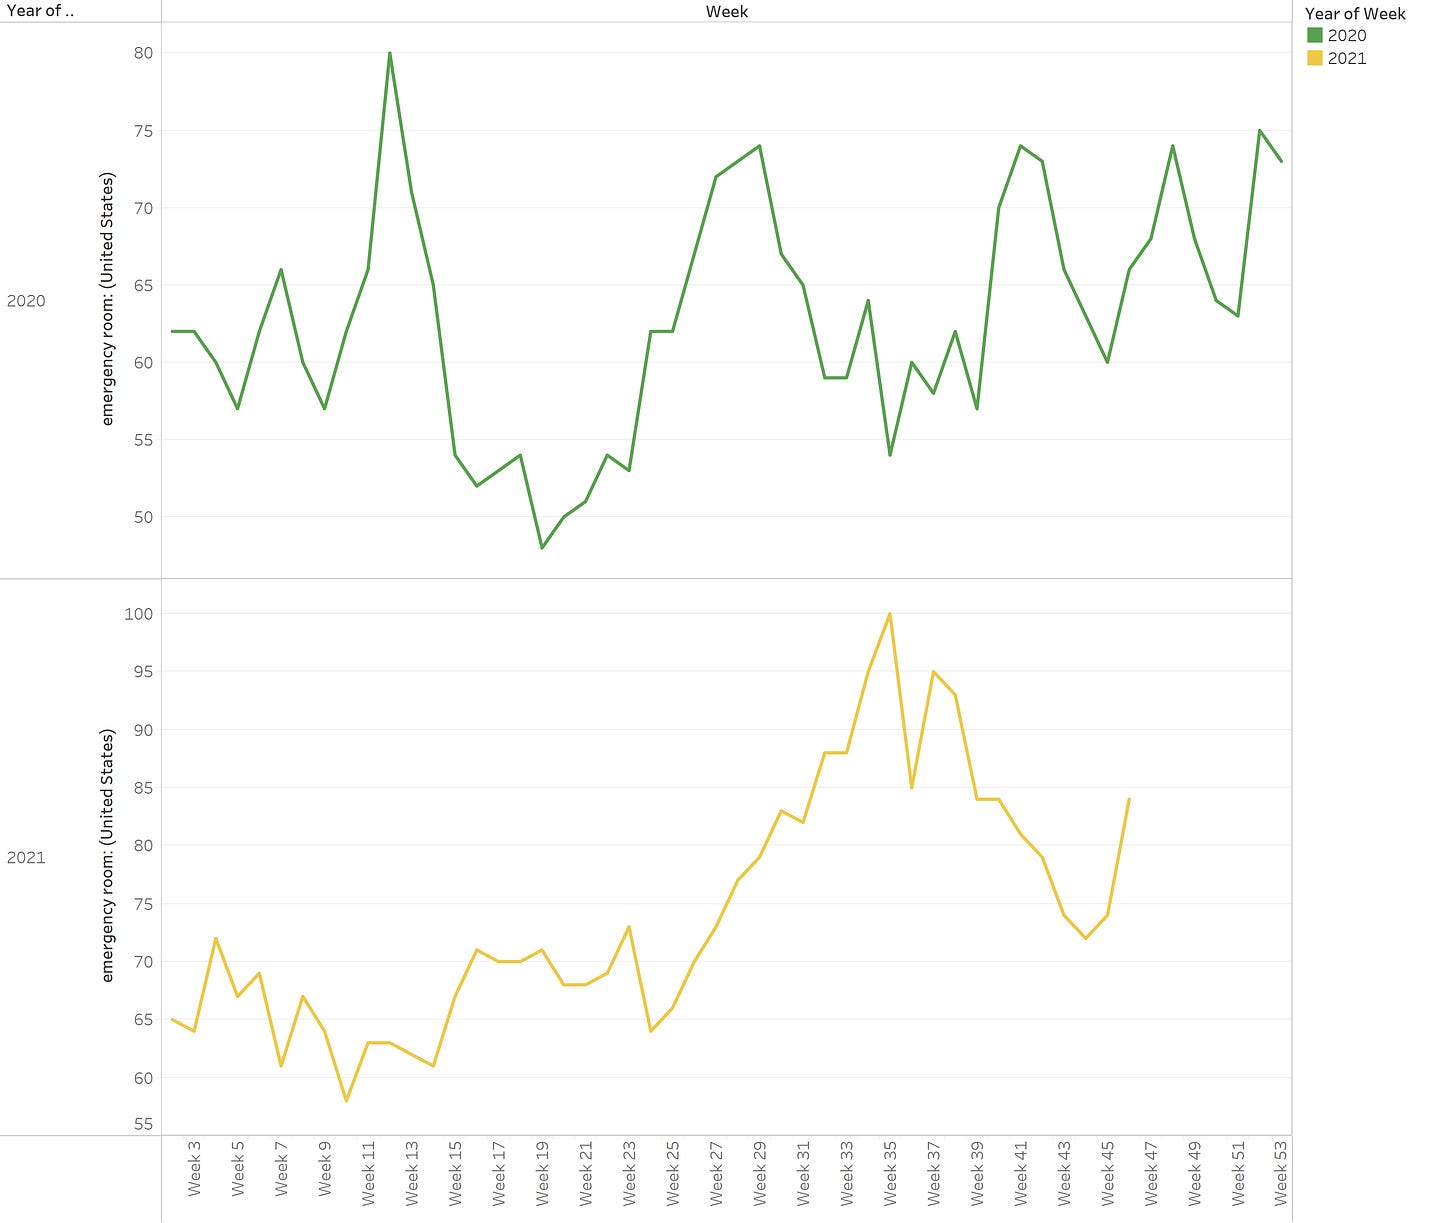
Now on to 2020-2021 (the COVID years)
2020 certainly shows more variability than previous years, however it actually shows a lower point in the ~week 30-40 range, while in 2021 it is peaking at that time.
While it would be irresponsible to claim this is proof that seasonality is not a critical confounder in examining the relationship between non-COVID ED Visits and Vaccinations, this does perhaps shed some doubt on that claim & might encourage further examination of correlation witnessed in the previous post.
US Total: Non-COVID ED Visits (Red) vs. Running Total of People Administered 1st Dose (Green)


Brilliant :-)
ED is a very sensitive indicator of microclots. A man might have tingling in fingers and toes also. Viagra or Cialis might not work. Even a frisky 20 year old ex-gymnast GF fails, so you know it was the 3rd jab in a red "hot shot State" that injured you.