Dog Bites Man: Healthier States Had Less COVID Deaths than Unhealthier States
Overall health as a predictor of COVID health
What causes the variation in COVID-19 deaths between the various US States? Is it the policies, or is it something else. I believe the question of how much policies have influenced COVID deaths has been explored many times. Nevertheless, I will do a quick analysis of that, followed by an alternative hypothesis.
Data Analyzed:
1. Provisional COVID-19 Deaths by Sex and Age from the CDC includes COVID and All Deaths by month for 2020 & 2021 by sex and age bracket.
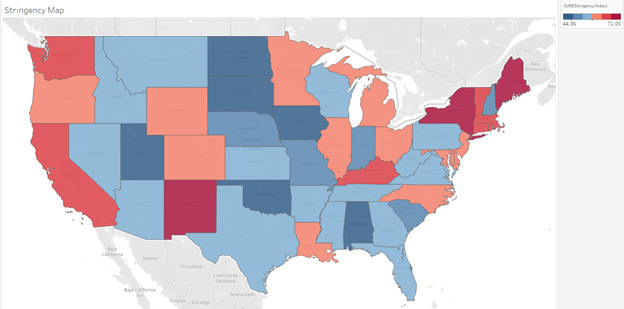
2. US States Stringency Index. This is data that comes up with a score meaning to indicate how stringent a particular state is with regards to restrictions put in place. I found this data included here . I’m honestly not sure the original source of this index, but hopefully folks will think the scores largely align with their intuition on which states were more/less restrictive:
Analysis:
COVID Deaths vs Stringency Index
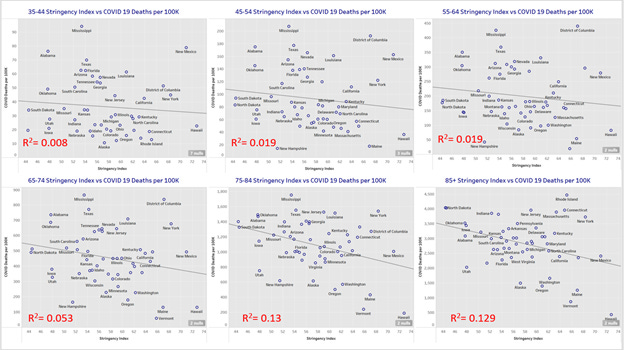
As a 1st step, wanted to do a simple plot & regression of stringency index vs. COVID-19 Deaths per 100K. As for nearly all things COVID, I think it is wise to look at this through an age stratified lens. Here are those plots for 6 age groups above 35 years old:
What we see is that for all age groups below 75, there is essentially no relationship. Perhaps the stringency index could be shown statistically significant for these ages if we were doing a multi-variable regression, but my personal belief is that it would be very hard to argue a state’s restrictions were making a meaningful difference for the <75 year olds. For the >75 groups, Stringency Index does appear statistically significant. I would argue, however that R-squared values if 0.13 are not that compelling.
COVID Deaths vs Other Deaths
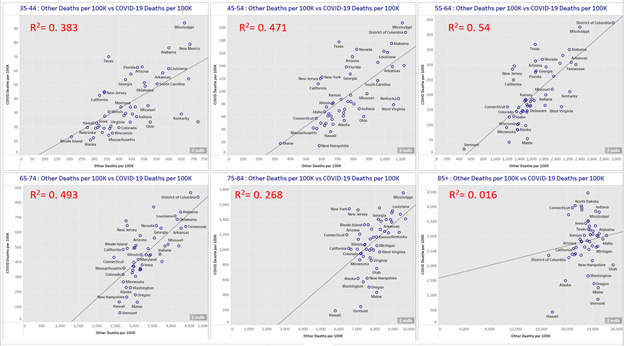
Moving on, a natural question that occurred to me to explore was how do COVID-19 deaths in a state compare to deaths from other causes in those states. Again, very simple analysis. I simply plot and regress COVID deaths vs. “Other” Deaths per 100K in a state. That is, the above data source has All Death figures and COVID Deaths. I subtract the latter from the former to get Other Deaths. What do we see?
Wow! Unlike the previous analysis, we see that for the <75 age groups, there is very high correlation between Other Deaths and COVID Deaths. What does this mean? I take this as meaning that if we want to predict how bad COVID will hit a state, the state’s overall health (as demonstrated by it non-COVID death rate) is extremely predictive. In other words, Mississippi has a lot more COVID deaths per 100K than Vermont, but it also has lots more other deaths. My take is that indicates that the overall health of folks in MS is worse than VT and that is causing the bad COVID outcomes, it’s not because they had fewer restrictions.
Now, looking at the older groups. The R-squared falls significantly for 75–84-year-olds (but is still much more significant than the stringency index regression). For 85+, it is no longer statistically significant. When I look at these categories, one thing I notice is that there is just not as much variation in Other Deaths among the states in these age groups (i.e., a high number of old people die in all states), so harder perhaps to use this variable as a regression variable.
Looking more deeply at older folks
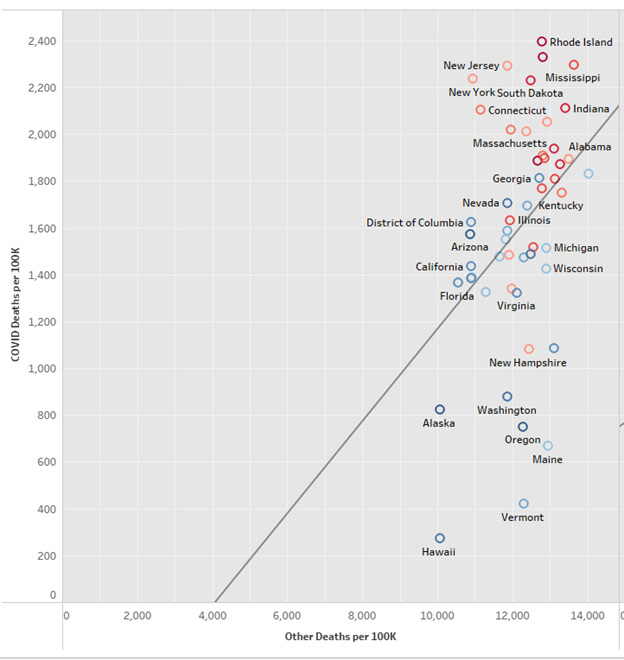
I was kind of unsatisfied with our ability to understand what was going on with 75+ year old & then I remembered an idea I had a few months back. Another chart, this time I combine 75-84 & 85+ and plot Other Deaths vs. COVID Deaths, but I color the circles based on # of nursing home residents per (over 75) population. Goes from dark blue (few nursing home residents) to dark red (many nursing home residents):
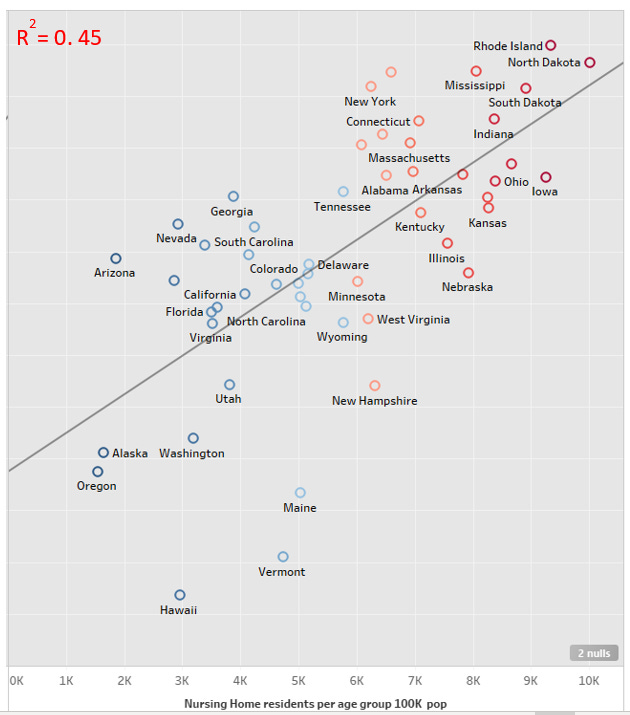
Now we’re getting somewhere. Now, changing the x-axis to be Nursing Home Residents per 100K (over 75) population.
The R-squared value is 0.45.
Conclusions:
1. Stringency of COVID measures within a state is not associated (<75 year olds) to weakly associated (>75 year olds) to COVID Deaths in a state.
2. Overall health (as measured by Other Death Rate) was very much associated with COVID Deaths for all <75 age groups.
3. For >75, there is a high association with the size of the nursing home population and COVID Deaths. This can be because of two things. First, old people in a nursing home are likely of significantly worse health than old people outside of a nursing home. Second, nursing homes are likely ideal conditions for an infectious virus to spread.


