


Best predictor of COVID deaths in a county

Recently I discovered a very interesting data source for health characteristics of populations at the US county level. This dataset is provided by the University of Wisconsin Population of Health Institute. I thought it would be interesting to merge this data with the other county level data I have been compiling to see if there were any additional insights we could gather regarding how COVID impacted different geographic areas.
A natural question (and one we’ve explored before) is whether we can find specific factors about a geographic area that help explain the amount of COVID deaths within that area. In this post, I will look at two possible factors to determine if either can help predict COVID deaths and whether one factor seems to be a better predictor than the other. This below chart shows plots, by region and at the county level (each circle is a US county), COVID deaths per 100K population on the y axis, and 2 different possible explanatory factors on the x-axis. Notes: 1. I have not yet revealed the identity of those factors. 2. AK, HI are not included based on geography and FL, NE, NJ are not included based on inconsistent county level data reporting.

In order to assess how well the regression fits, below is a table of the R-squared values for each region for factor 1 (left) and factor 2 (right).

Recall that R-squared value range from 0 (no correlation between x & y) to 1 (perfect correlation between x & y). I have colored red the instances where one of the factors clearly has higher correlation with COVID deaths/100K than the other factor.
Summary
As is obvious from the charts, COVID deaths/100K appear to decline as factor 1 increases, and appears to increase as factor 2 increases.
For 2 regions (Middle Atlantic and Southeast), factor 1 has significantly higher correlation with COVID deaths/100K than does factor 2.
For the South Atlantic, both factors show very high correlation with COVID deaths/100K
For 2 regions (South, Northern Rockies and Plains) neither factor show high correlation with COVID deaths/100K
For 6 regions (New England, Ohio Valley, Upper Midwest, Southwest, Northwest, and West), factor 2 has significantly higher correlation with COVID deaths/100K than does factor 1.
Now, in the hypothetical situation that one were asked to predict the rate of COVID deaths in a given county and were allowed one piece of data (factor 1 or factor 2), it would seem preferable to know factor 2.
And now for the big reveal….

Factor 1 is the % of a given county’s adult (18+) population that is fully vaccinated
Factor 2 is the % of a given county’s population that are smokers
Note that this is not necessarily saying that being a smoker increases your chances of dying from COVID (although it might). I suspect that a good part of the explanation is that non-smokers would generally be more health conscious than smokers and so geographic areas with low smoking rates would be of better general health than those with high smoking rates and therefore are less likely to have serious illness when they get COVID.
It is far to easy for people who are looking to push a certain narrative to only look at the left hand side of the chart above and say more vaccinations lead to less COVID deaths. This may be true but it is not a simple question & the fact that the % of smokers in an area appears more predictive than the % vaccinated should give serious pause to drawing conclusions. It may just be that more health conscious people are more likely to be vaccinated and more health conscious people do better with COVID… making it appear that the vaccine is the reason, but general health is more important.
***Clarification: Forgot to mention initially, the COVID deaths are from 3/1/21 to present, not from beginning of pandemic. This was chosen because that was roughly the earliest we would expect vaccines to have been reasonably widespread.
Addendum
To answer a question from Rjohnphil in the comments, some of the other factors I looked at were:
% 65 and older
% Adults with diabetes
% Adults with obesity
% Excessive drinking
% Fair or poor health
% Physically inactive
Here is a view of which of these factors provided the best regression fit for each region:
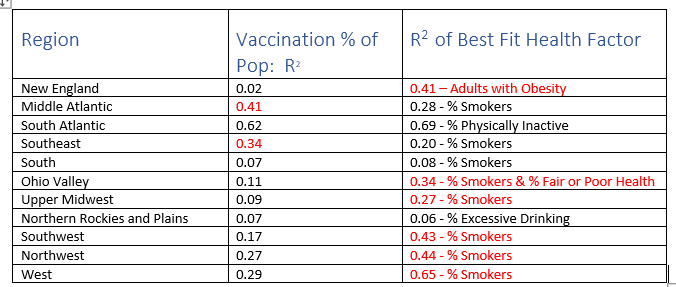
This is interesting. I was just looking at the dataset that you linked to. What other variables did you look at? I thought adult obesity would likely produce a strong correlation. Could you create a composite figure that incorporated a number of these stats (smoking, obesity, age)?
I noted while looking at data from California that the CFR for the Asian population was lower than average and I see that the data looks similar in my home state of MN. I thought perhaps there might be some inherited immunity within that pop but may be just a function of age.